Quick Dashboard Creation
Dashboards consolidate functionally related visual reports on a single interface, building data insight scenarios through multi-dimensional data analysis. You can create them in the following three ways:
| Creation Method | Use Cases | Core Capabilities |
|---|---|---|
| Create from Template | Use preset monitoring views to see results quickly | Built-in templates for HOST, K8s, APM, etc. |
| Create Custom Dashboard | Fully self-designed layout and queries | Drag-and-drop 30+ chart types, configure variable linkage |
| Create by Import | Reuse existing configurations or team-shared templates | Support JSON/ZIP formats, batch migration |
Create from Template
Using built-in templates, you can set up professional monitoring views within 5 minutes, without starting from scratch.
Step 1: Select a Scenario Template
- Click "New Dashboard" in the top left corner.
- Select a template from the System Views.
Step 2: Define Main Configuration Items
- The dashboard name defaults to the selected view's name and can be changed as needed.
- Define the dashboard's Identifier ID.
- Optionally enter a description for this dashboard.
- Select Labels for easier subsequent grouping and management.
- Select the Visibility Range for the current dashboard.
- Click OK to create successfully.
Identifier ID
This ID is defined as identifier and is used to determine the uniqueness of a dashboard or view.
It can be used to configure jump links for charts, enabling unique deterministic positioning.
: Define the dashboard's identifier ID as abc. In the final exported JSON file, the parameter is: "identifier": "abc"

: When configuring a jump link for a chart, add the link to the dashboard with identifier ID abc as:
Besides dashboards, this also applies to views:
// The type field optional values: inner(user view), sys(system view). Defaults to inner if not provided:
/scene/builtinview/detail?identifier=abc&type=sys // System view
/scene/builtinview/detail?identifier=abc&type=inner // User view
/scene/builtinview/detail?identifier=abc // User view
Visibility Range
The visibility range for a dashboard includes:
- Public: Accessible to all members in the workspace.
- Visible only to self: Only the creator can view it.
- Custom: Restrict visibility to specific members.
Note
- Non-public dashboards shared via links are not visible to non-creators.
- The switch here only controls the publicity of the current dashboard and does not affect other rules.
Custom Data Insights
When preset templates cannot meet your needs, you can build a fully customized visualization solution through the following operations.
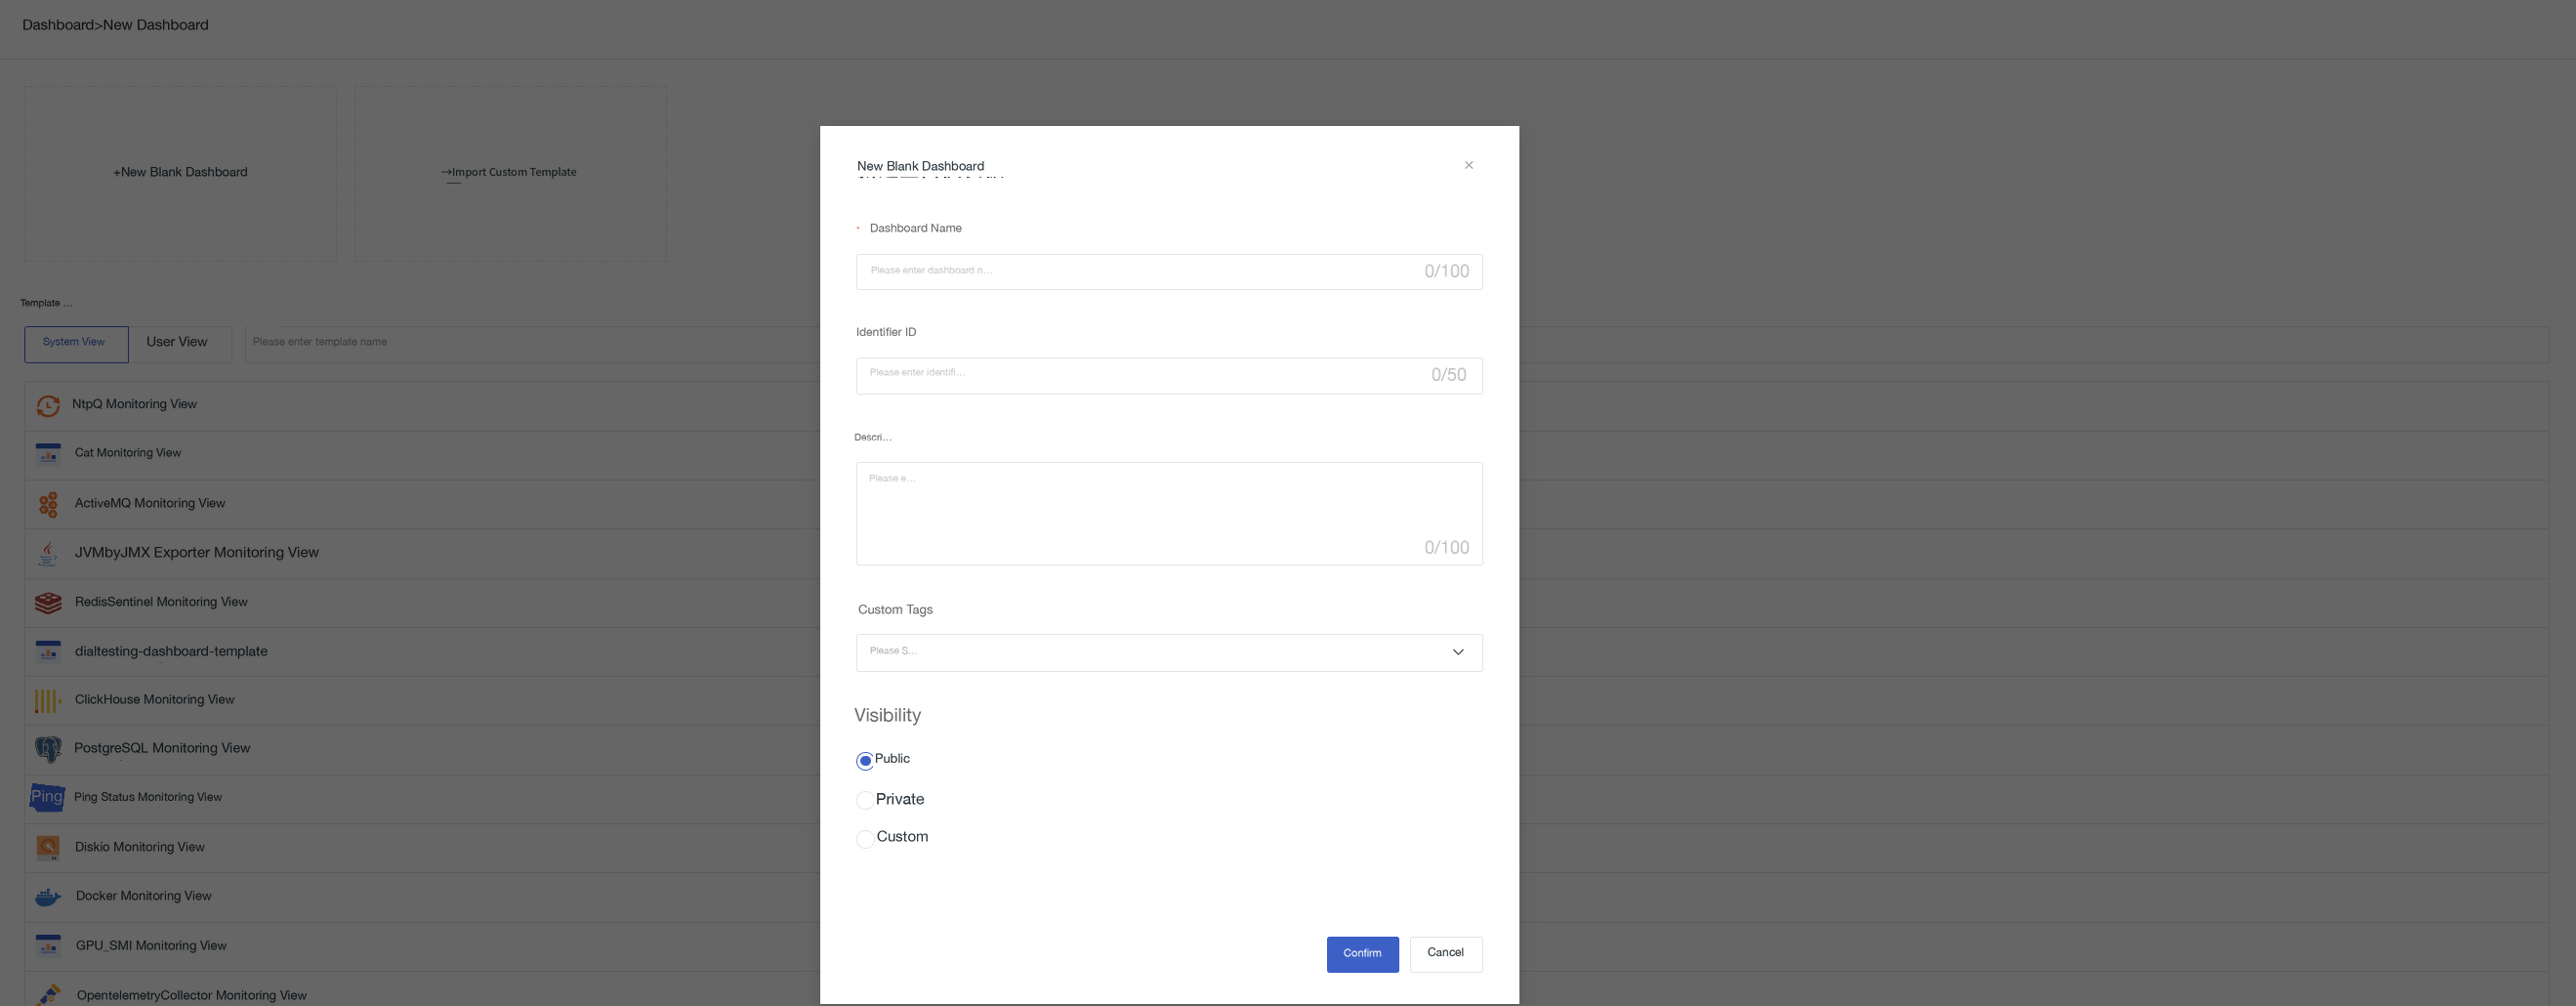
- Click to enter Dashboard > New Dashboard > New Blank Dashboard.
- Configure basic information (name, identifier ID, description, labels, visibility range).
- Click OK to create successfully.
AI Automatic Dashboard Creation
Through TOBY AI, you can describe your analysis needs in natural language. AI will generate a dashboard draft, which can be quickly created after confirmation.
Click to view more details.
Step 1: Describe Requirements
- Go to Scene > Dashboard > New Dashboard.
- Select AI Automatic Dashboard Creation.
- Describe the metrics or scenarios you want to analyze in the input box, or click the quick examples above to use them with one click.
Quick examples include:
- Analyze the change in API error rate over the past 7 days and display the TOP5 services.
- Generate a dashboard for analyzing failures of payment-service in the last 24 hours.
- Help me create a dashboard showing interface latency trends and slow service rankings.
Step 2: Confirm Draft
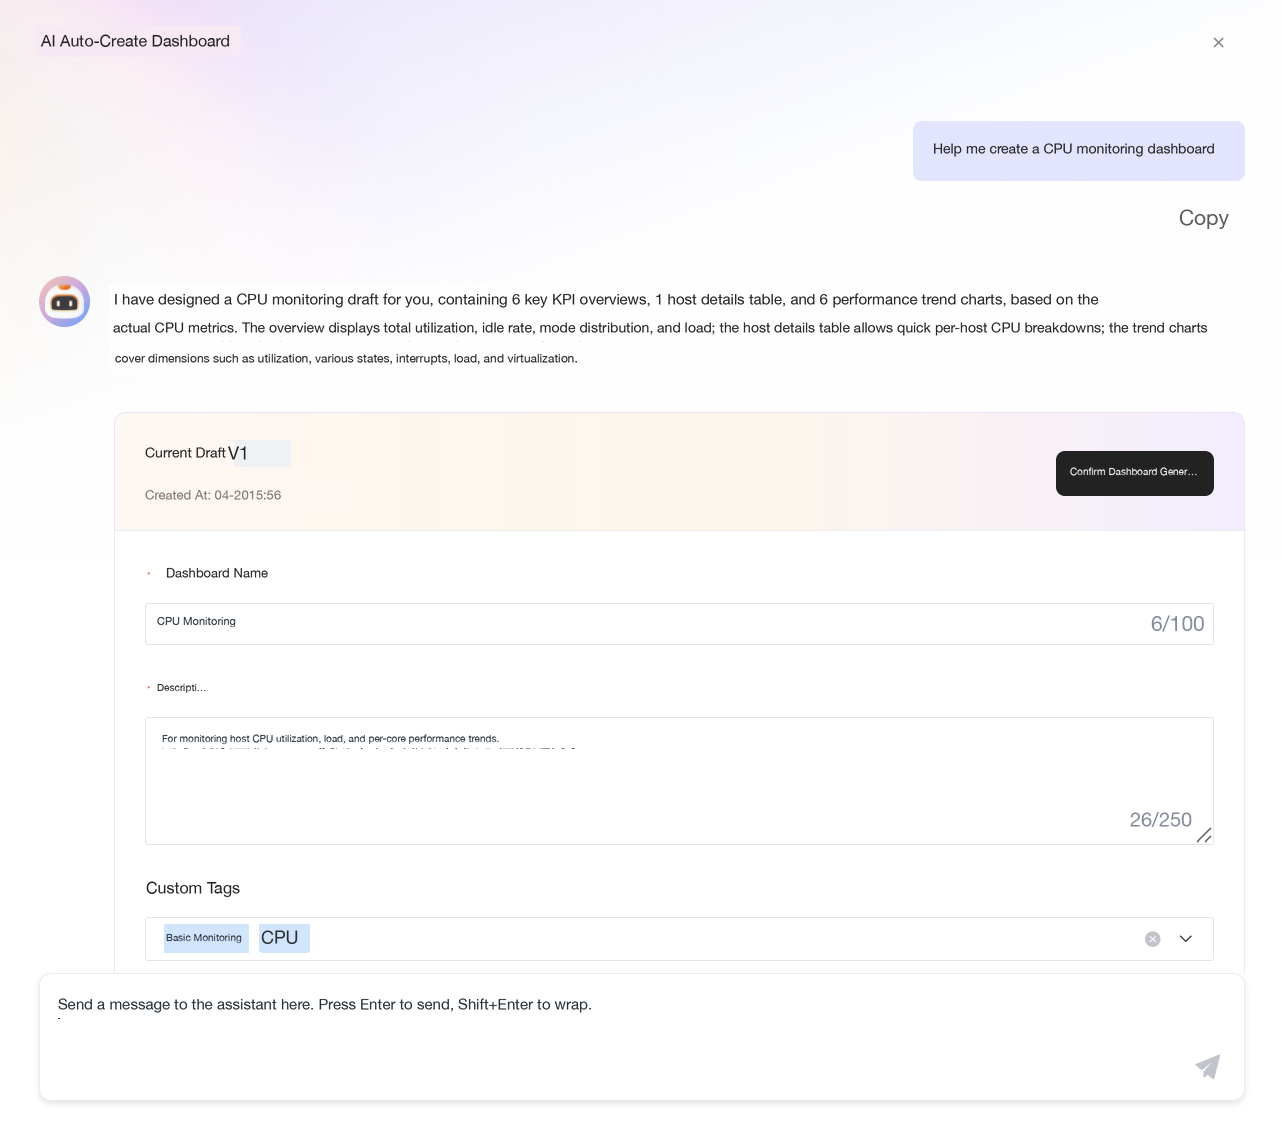
After AI generates the dashboard draft, you can review and edit the dashboard name, description, custom labels, and visibility range. If chart adjustments are needed, you can continue describing modification requirements in the bottom input box (e.g., "change the line chart to a bar chart", "add a chart for CPU load").
After confirming everything is correct, click Confirm and Generate Dashboard.
Step 3: Preview and Save
After entering the preview page, the system will dynamically generate charts. Once all charts are generated, click Save Dashboard to complete the creation.
If you exit midway, clicking "New Dashboard" again will allow you to choose to continue the last draft or start a new creation.
Import Dashboard
Besides the above two methods, if you need to reuse existing configurations, migrate across workspaces, or obtain ready-made templates from internal teams, you can quickly create dashboards by importing.
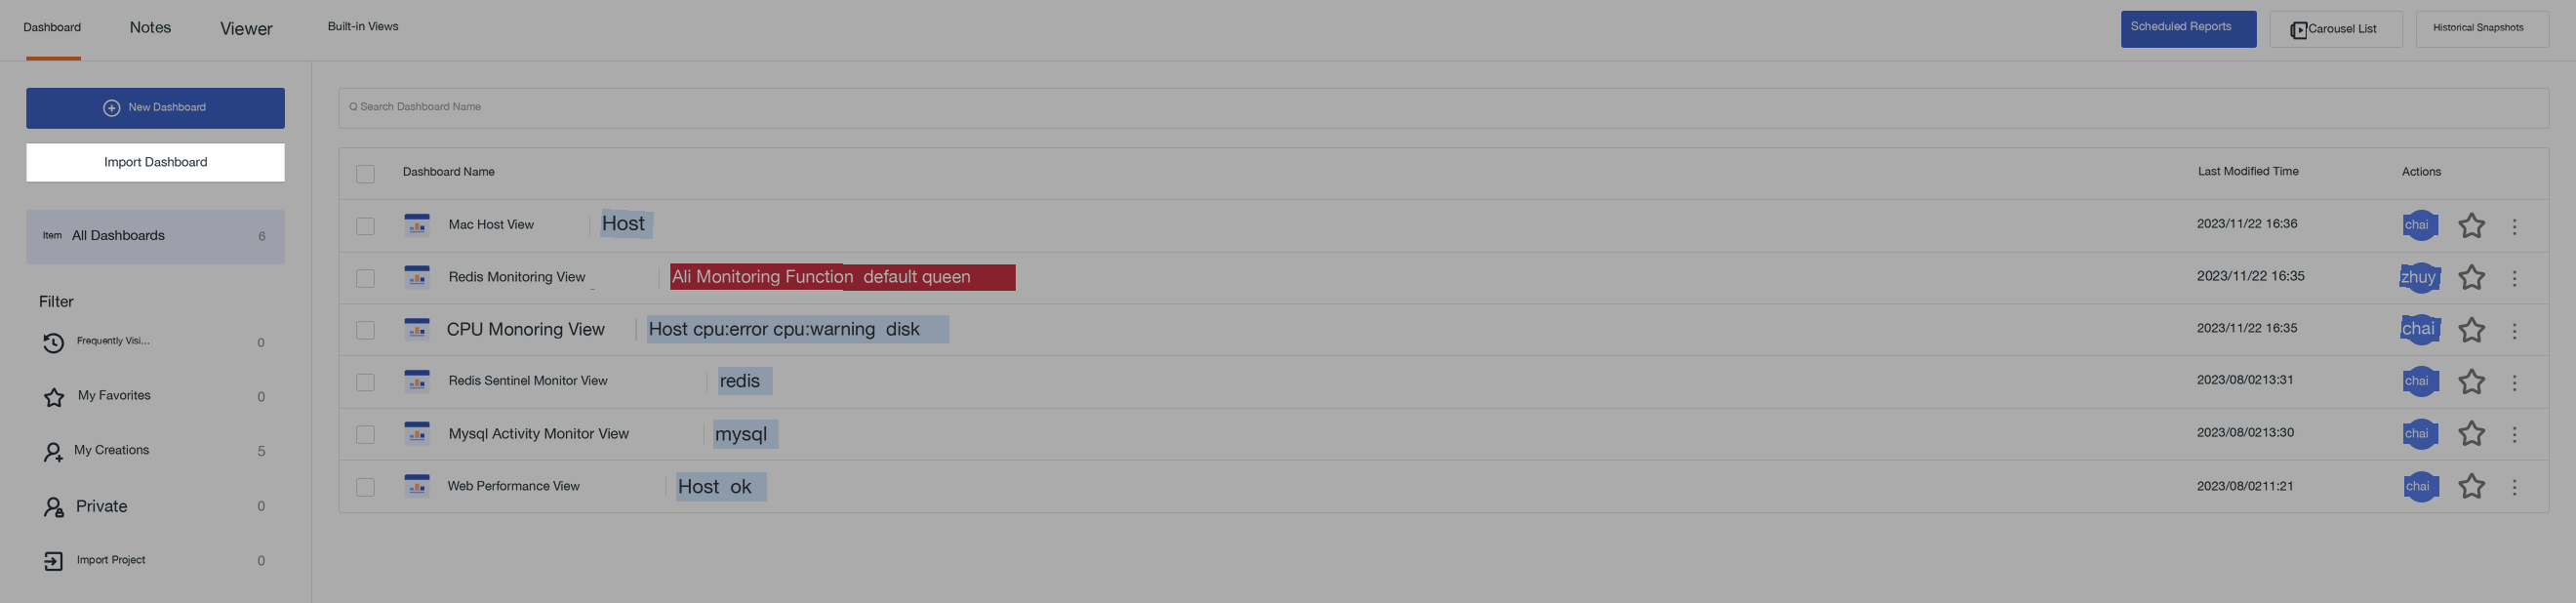
After clicking New Dashboard > Import Dashboard, the system will pop up an import window, supporting the following two dashboard types:
| Type | Description |
|---|---|
| Official Dashboard | Selected by default, supports importing TrueWatch standard format dashboard JSON files |
| Grafana Dashboard | Selecting this shows compatibility prompts, supports importing JSON files exported from Grafana ❗️Some advanced features in Grafana dashboards differ from this platform. After import, related content may not display normally or may require manual reconfiguration |
Steps to Import Official Dashboard
- Enter the Official Dashboard import tab page.
-
Upload
.jsonor.zipfiles..json: Single dashboard configuration, used to import a specific dashboard..zip: Multiple dashboards packaged in bulk, used for team template distribution or complete environment migration.
-
Configure basic information (name, identifier ID, description, labels, visibility range).
- Click OK to create successfully.
Special Handling for ZIP Batch Import
The system uses whether the identifier ID is duplicated as the detection standard:
- If not duplicated, import succeeds.
- If duplicated, you need to choose to skip, overwrite and create, or cancel.
During batch import, if the user does not have edit permission for the original dashboard with a duplicate identifier ID, the system will forcibly apply the "skip" policy, and this situation will not be prompted in the processing interface.
After successful import, you can go to Dashboard > Import Items to view the batch import results.
Steps to Import Grafana Dashboard
- Enter the Grafana Dashboard import tab page.
- Upload a
.jsonformat file. - Click OK to create successfully.
Further Reading
You might need the following subsequent operations: