Variable Queries
View variable queries are used to define the value range and data source of variables. They support configuring whether the value range follows the dashboard time widget, meeting different data filtering needs.
Value Range Control
The selectable values obtained from the query can be chosen to be affected by the dashboard time range or not:
| Mode | Description | Use Cases |
|---|---|---|
| Follow Dashboard Linkage | Filter data based on the dashboard time widget | View only recently active hosts to avoid historical garbage data |
| Do Not Follow Dashboard Linkage | List all historical data | Need full enumeration, such as all service names (services usually do not change frequently) |
Main Query Methods
View variables currently support five types of query methods. You can choose as needed:
| Query Method | Use Cases | Key Features |
|---|---|---|
| DQL Query | Querying non-metric data such as LOG, objects, APM, etc. | The only method supporting all data types, supports cascade queries |
| PromQL Query | Querying only metric data and familiar with Prometheus | Syntax compatible with Prometheus ecosystem |
| Data Type Query | Quick point-and-click configuration without writing queries | Visual selection, zero code |
| External Data Source | Connecting to external databases like MySQL | Directly use SQL queries |
| Custom | Only a few fixed options | Directly fill in, no database query |
DQL Query
Supports all data types including Metrics, LOG, Infrastructure, Objects, APM, RUM, etc. It is the most comprehensive.
Basic Syntax Structure
Example:
Specifying Time Range
DQL supports directly specifying the time range in the statement, which takes precedence over the dashboard time widget:
| Syntax | Meaning |
|---|---|
[10m] |
Last 10 minutes |
[1h] |
Last 1 hour |
[1d] |
Last 1 day |
| Not written | Use dashboard time widget |
Example:
Show Function Query
Suitable for querying metric-related metadata information. Does not support time range.
Syntax Structure
| Syntax | Description |
|---|---|
show_measurement() |
Returns all measurements in the current workspace |
show_tag_key(from=["cpu"]) |
Returns tags under the measurement cpu in the current workspace |
show_tag_key(from=["cpu"],keyin=["host"]) |
Queries the list of host tag values for the measurement cpu in the current workspace |
Example:
# Query all measurements
SHOW METRIC_SET()

# Query all tags for a specified measurement
SHOW LABELS FROM M::cpu
PromQL Query
PromQL queries support handwritten query statements. By default, they use the time selected by the dashboard time widget to query and return data.
For information about PromQL queries, refer to PromQL Quick Start.
Data Type Query
If you need quick configuration and don't want to write query statements, you can directly select the data type and choose filter conditions on the page.
Supported data types:
- Metrics
- Basic Objects (hosts, containers, processes, etc.)
- Resource Catalog
- LOG
- APM
- RUM
In this mode, you cannot add time ranges or configure cascade queries.
External Data Source
If your target query selectable values are stored in an external database (e.g., MySQL, PostgreSQL), you can choose this query method to directly connect to the existing data system.
- Select the data source;
- Enter the query statement;
- Select the sorting method.
For more details, refer to External Data Sources.
Custom Query
If your target selectable values are fixed and limited in number, and there's no need to query the database, you can directly define a set of values for the view variable. Separate each option with an English comma ,, e.g., prod,test,dev,staging.
This query method does not support adding time ranges or configuring cascade queries.
Cascade Query
Used when multiple variables have a hierarchical relationship. For example:
- After selecting "service", the "environment" dropdown only shows environments for that service (not all environments).
- After selecting "environment", the "version" dropdown only shows versions for that environment.
Configuration Conditions
- Only DQL queries support cascade configuration;
- In the child variable's query statement, reference the parent variable's current value using
#{parent variable name}.
Configuration Example
The following uses the cascade filtering of view variables in the Web Application Overview of RUM as an example, illustrating the configuration for linkage queries based on service, environment, and version:
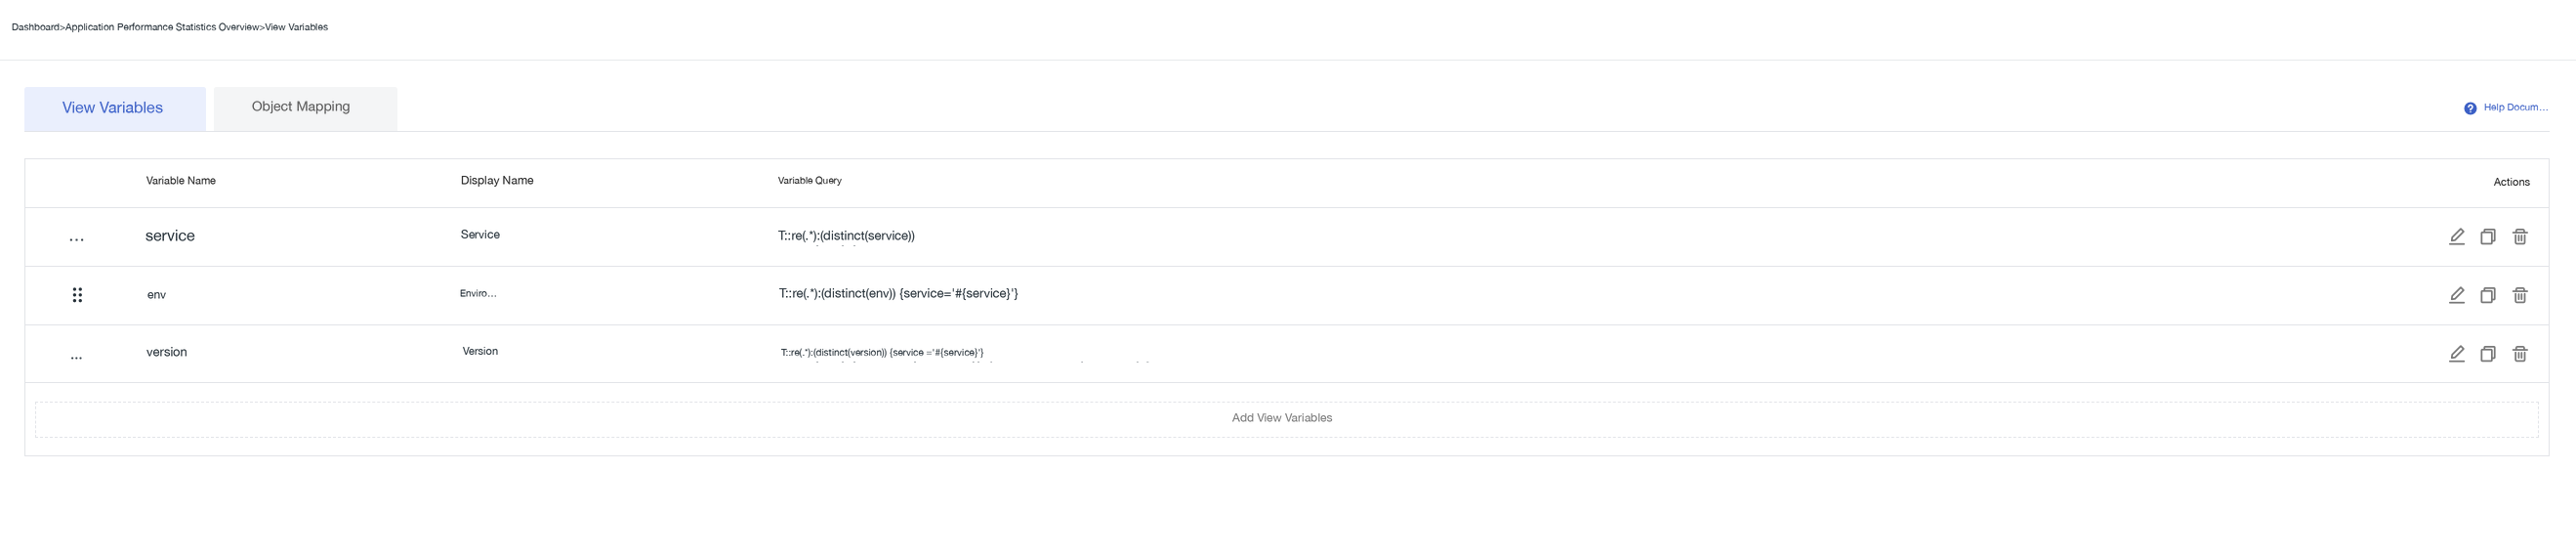
Three variable query statements need to be configured in the dashboard. The second and third query statements use #{variable name} configured in the first query:
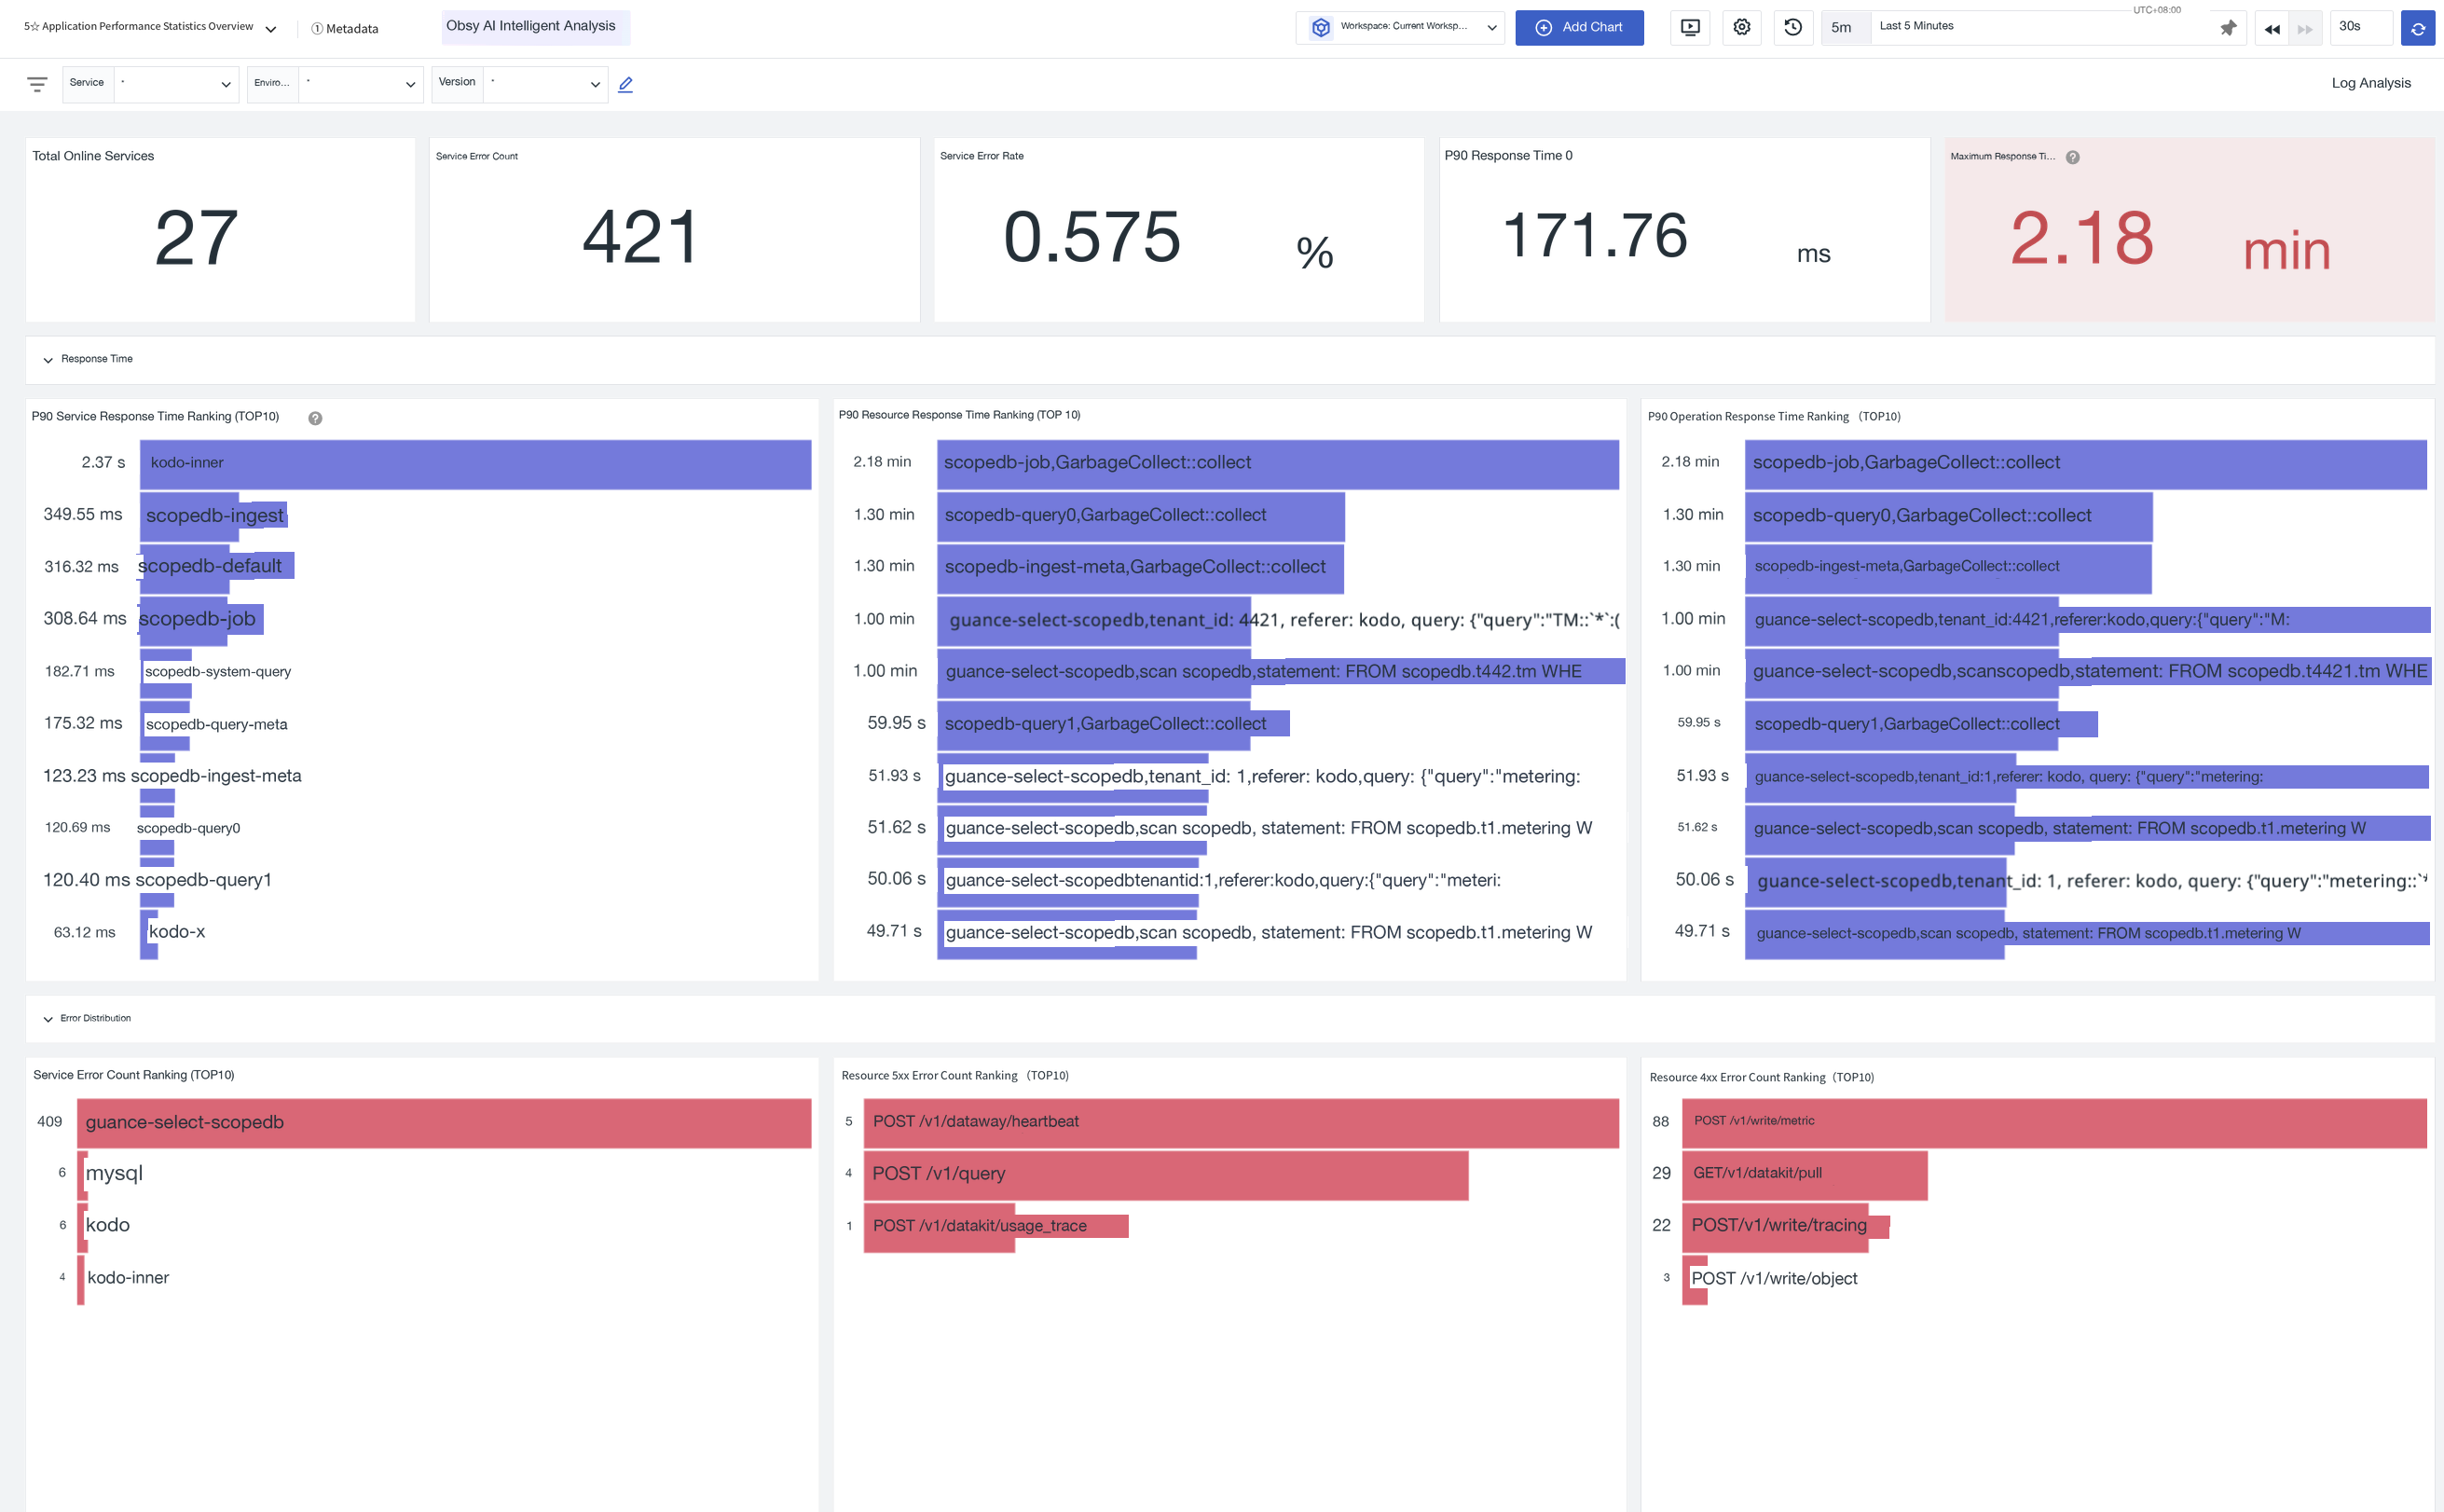
- Variable 1 (Service): Query all application lists:
- Variable 2 (Environment): Query all application lists, and the environment list selected in Variable 1:
- Variable 3 (Version): Query all application lists, and the version list selected in Variable 2:
Query Scenario Examples
Associating Charts
-
In the chart query, when filtering fields, select the variable for the
value; -
Switch the variable value in the scenario view, and the chart will be filtered and displayed based on the variable tag.
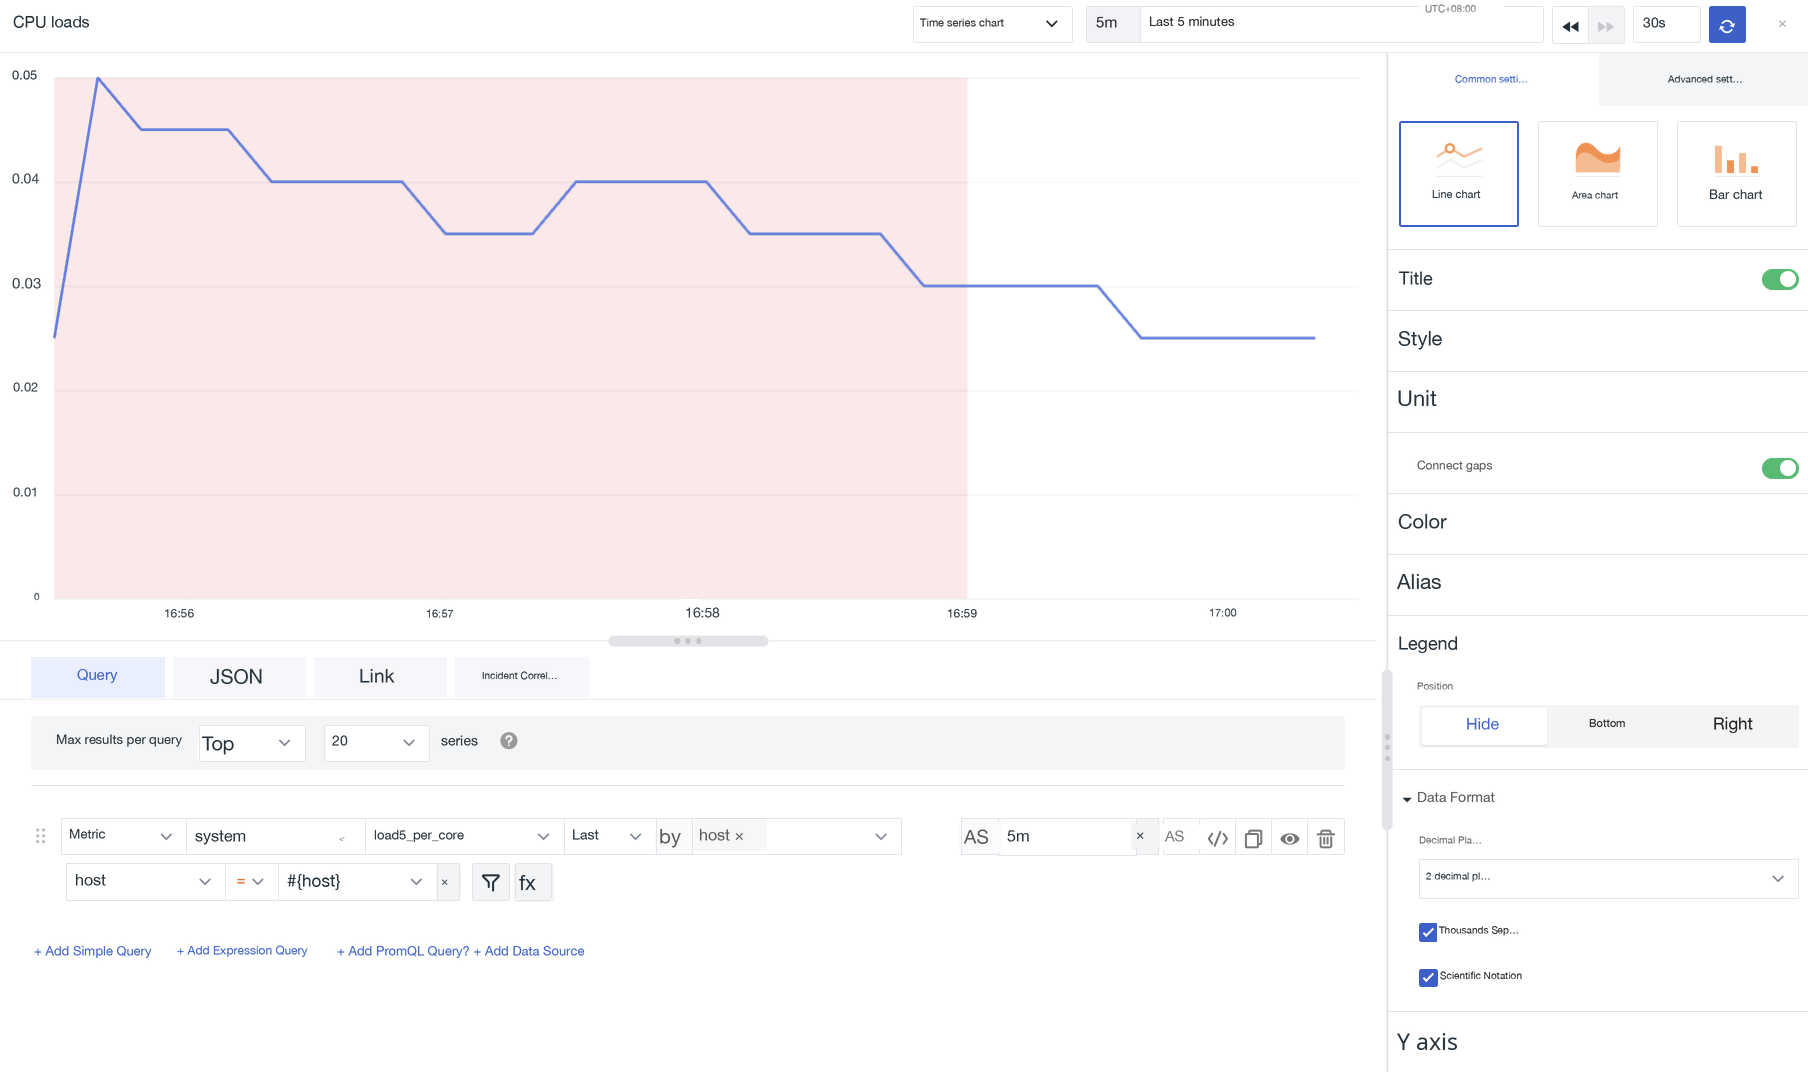
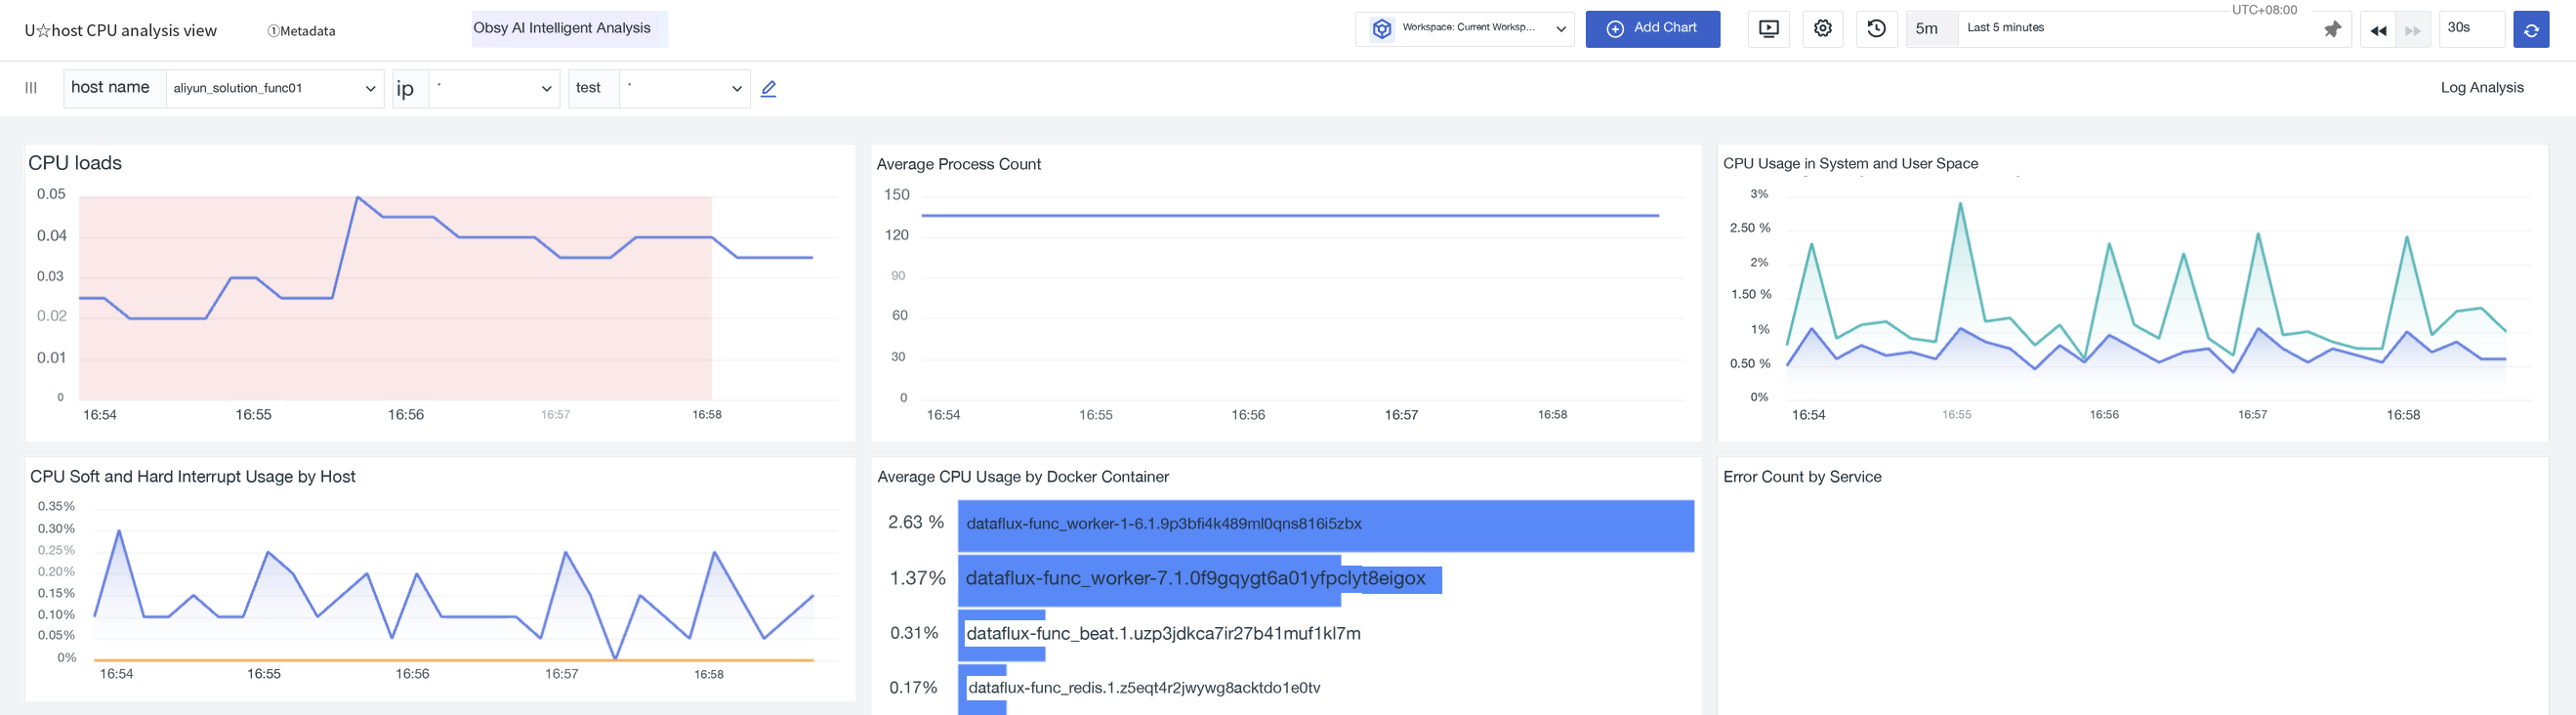
Chart Reverse Addition
Prerequisite
The corresponding DQL filter contains a by grouping condition.
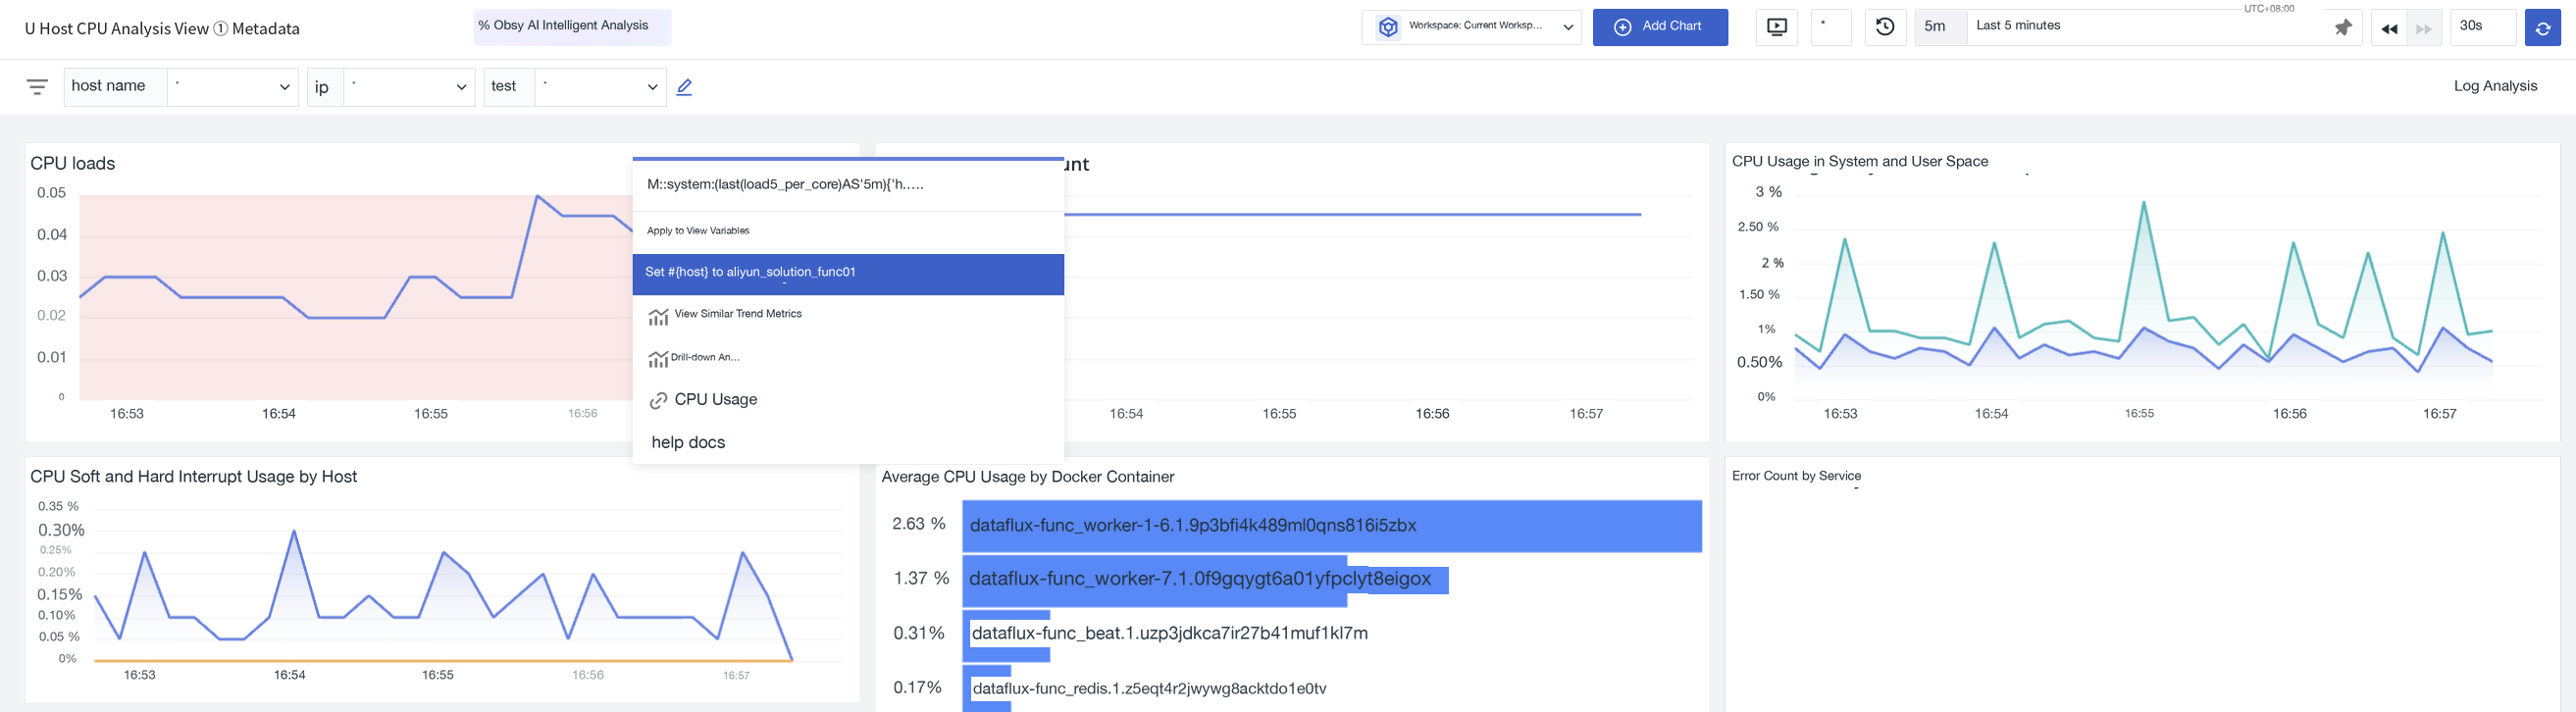
- After clicking on a specific time series or data point in the chart;
- Select Apply to View Variable;
- The system automatically fills in the query.