TOBY AI
TOBY AI is the intelligent assistant of the TrueWatch platform, integrating various intelligent service capabilities. Through natural language interaction, you can quickly answer product usage questions, summarize alert information, analyze anomaly data, or generate dashboards via AI.
Activate TOBY AI
Click the TOBY AI icon in the top navigation bar of the platform to expand the intelligent assistant drawer on the right. You can invoke the assistant on any page and switch pages or operate the navigation bar at any time. Click the icon again to collapse the drawer.
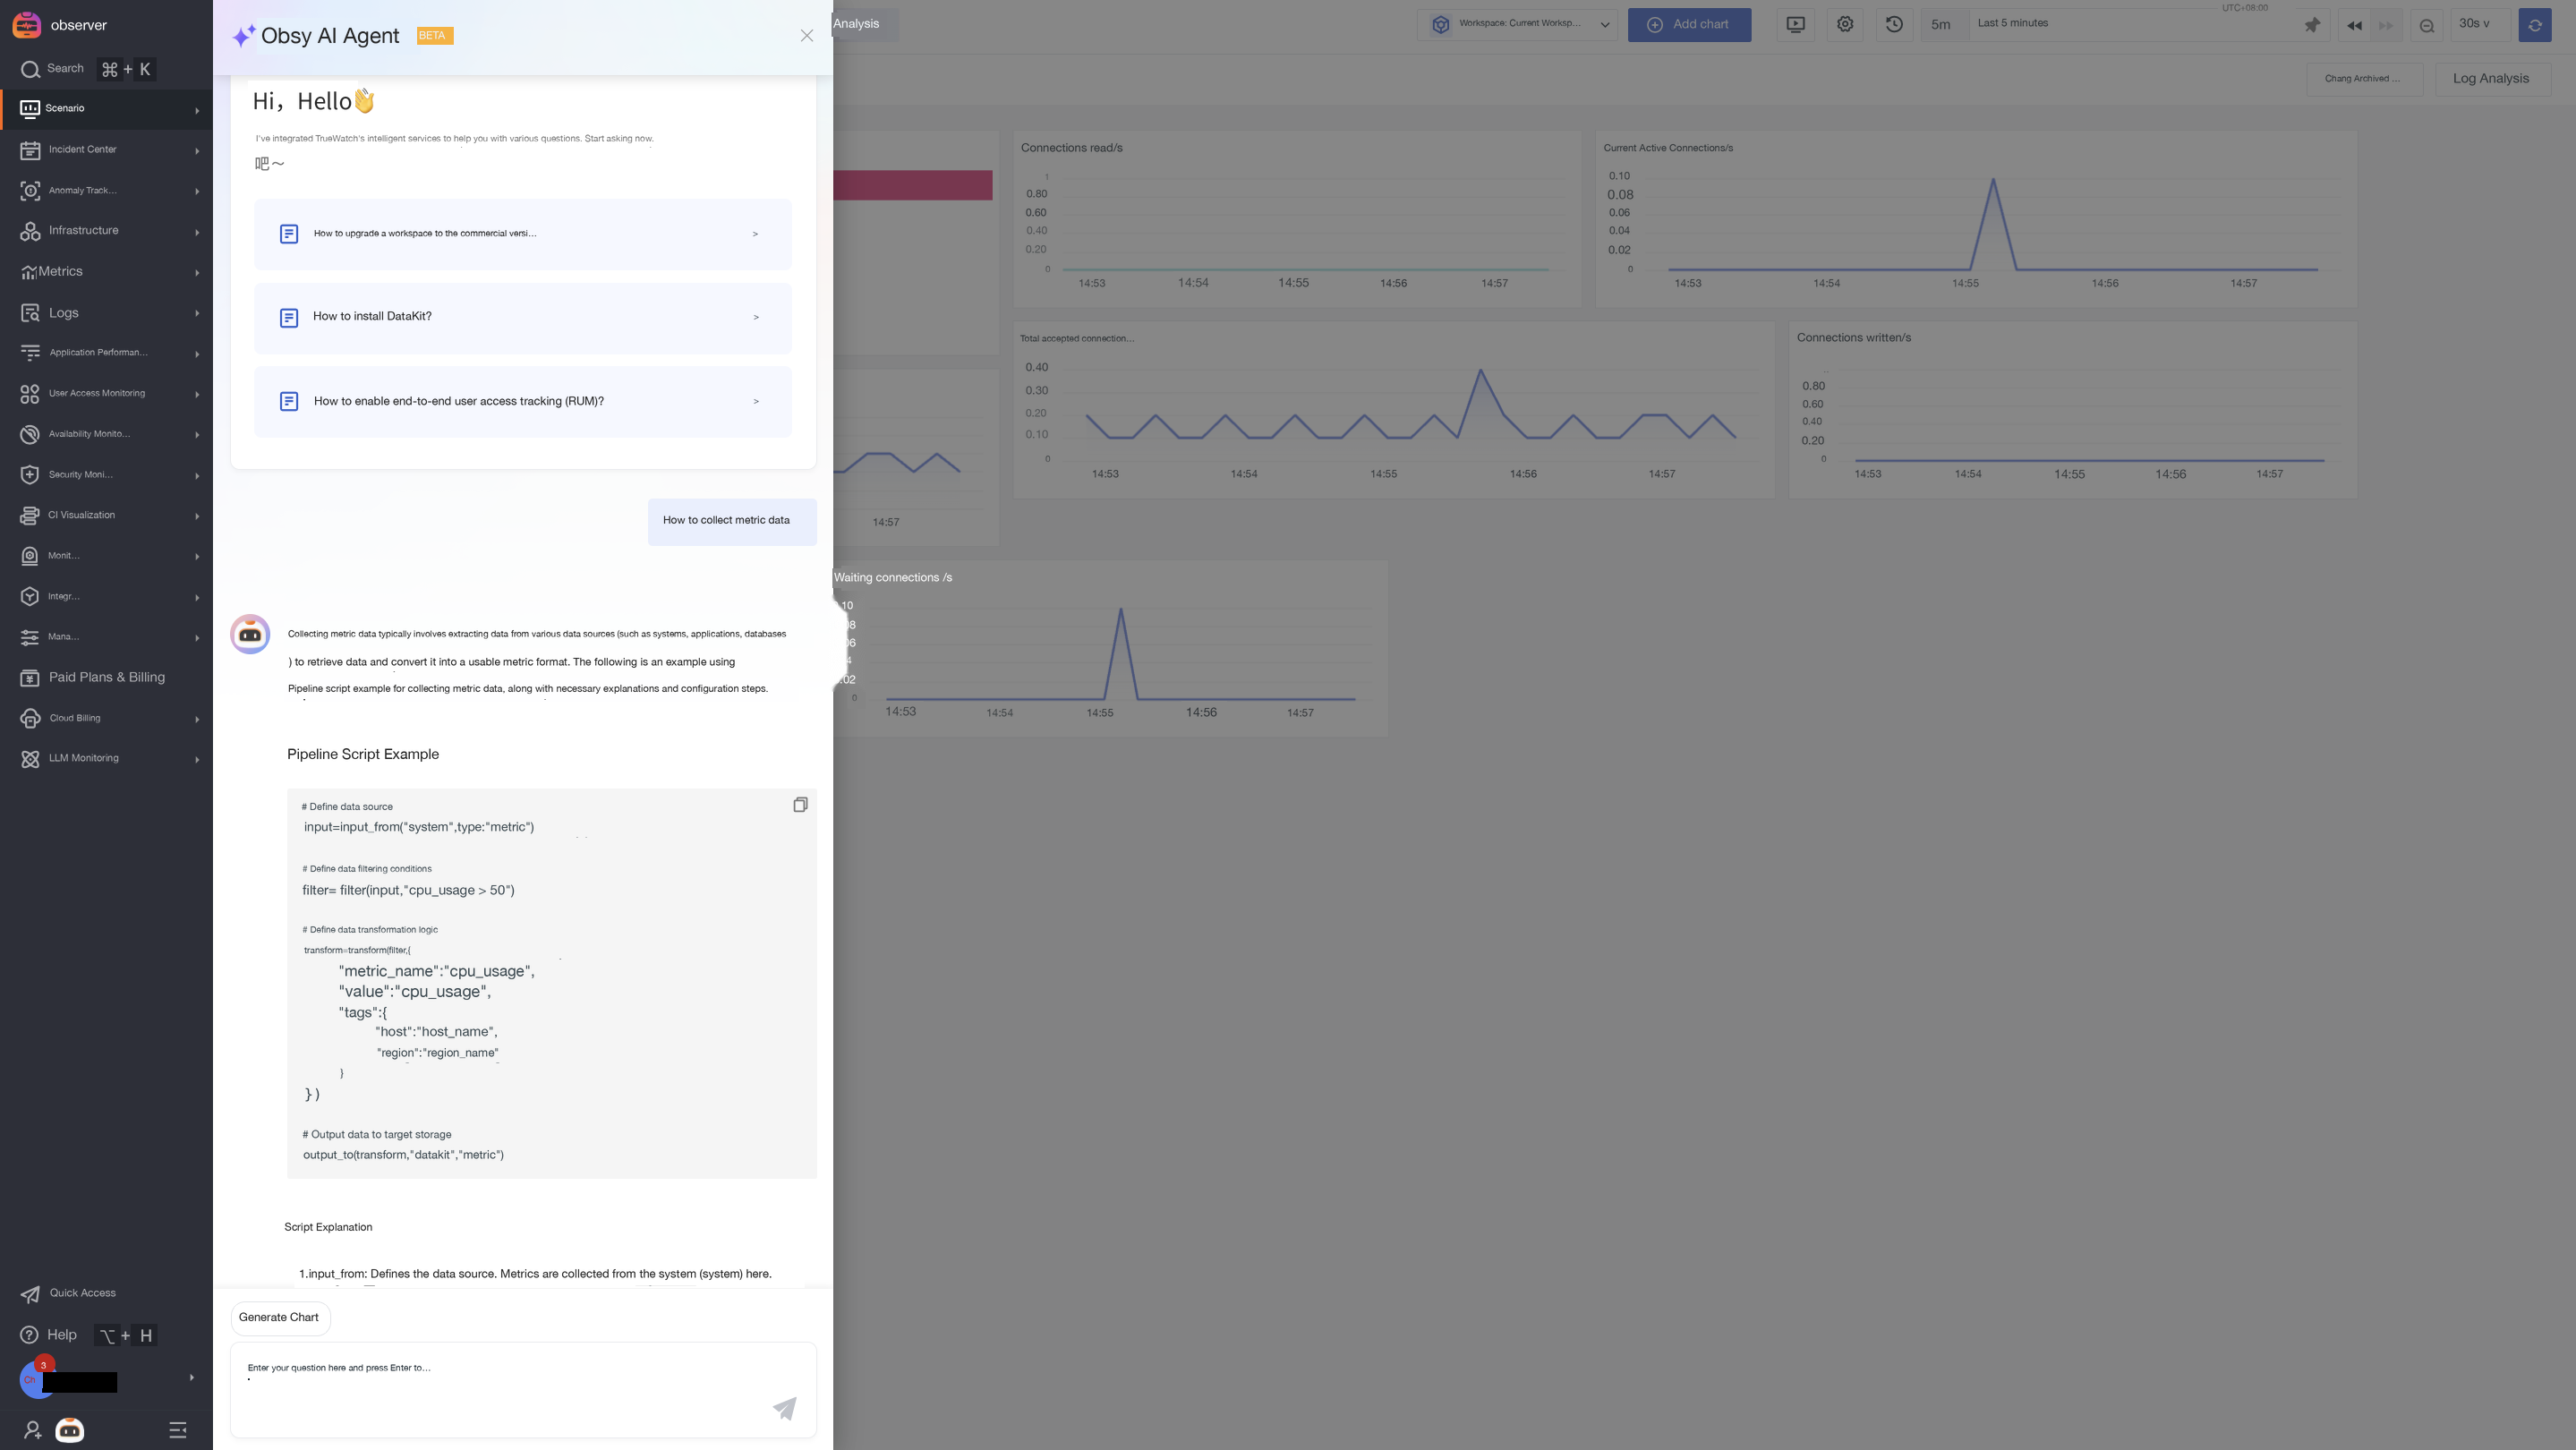
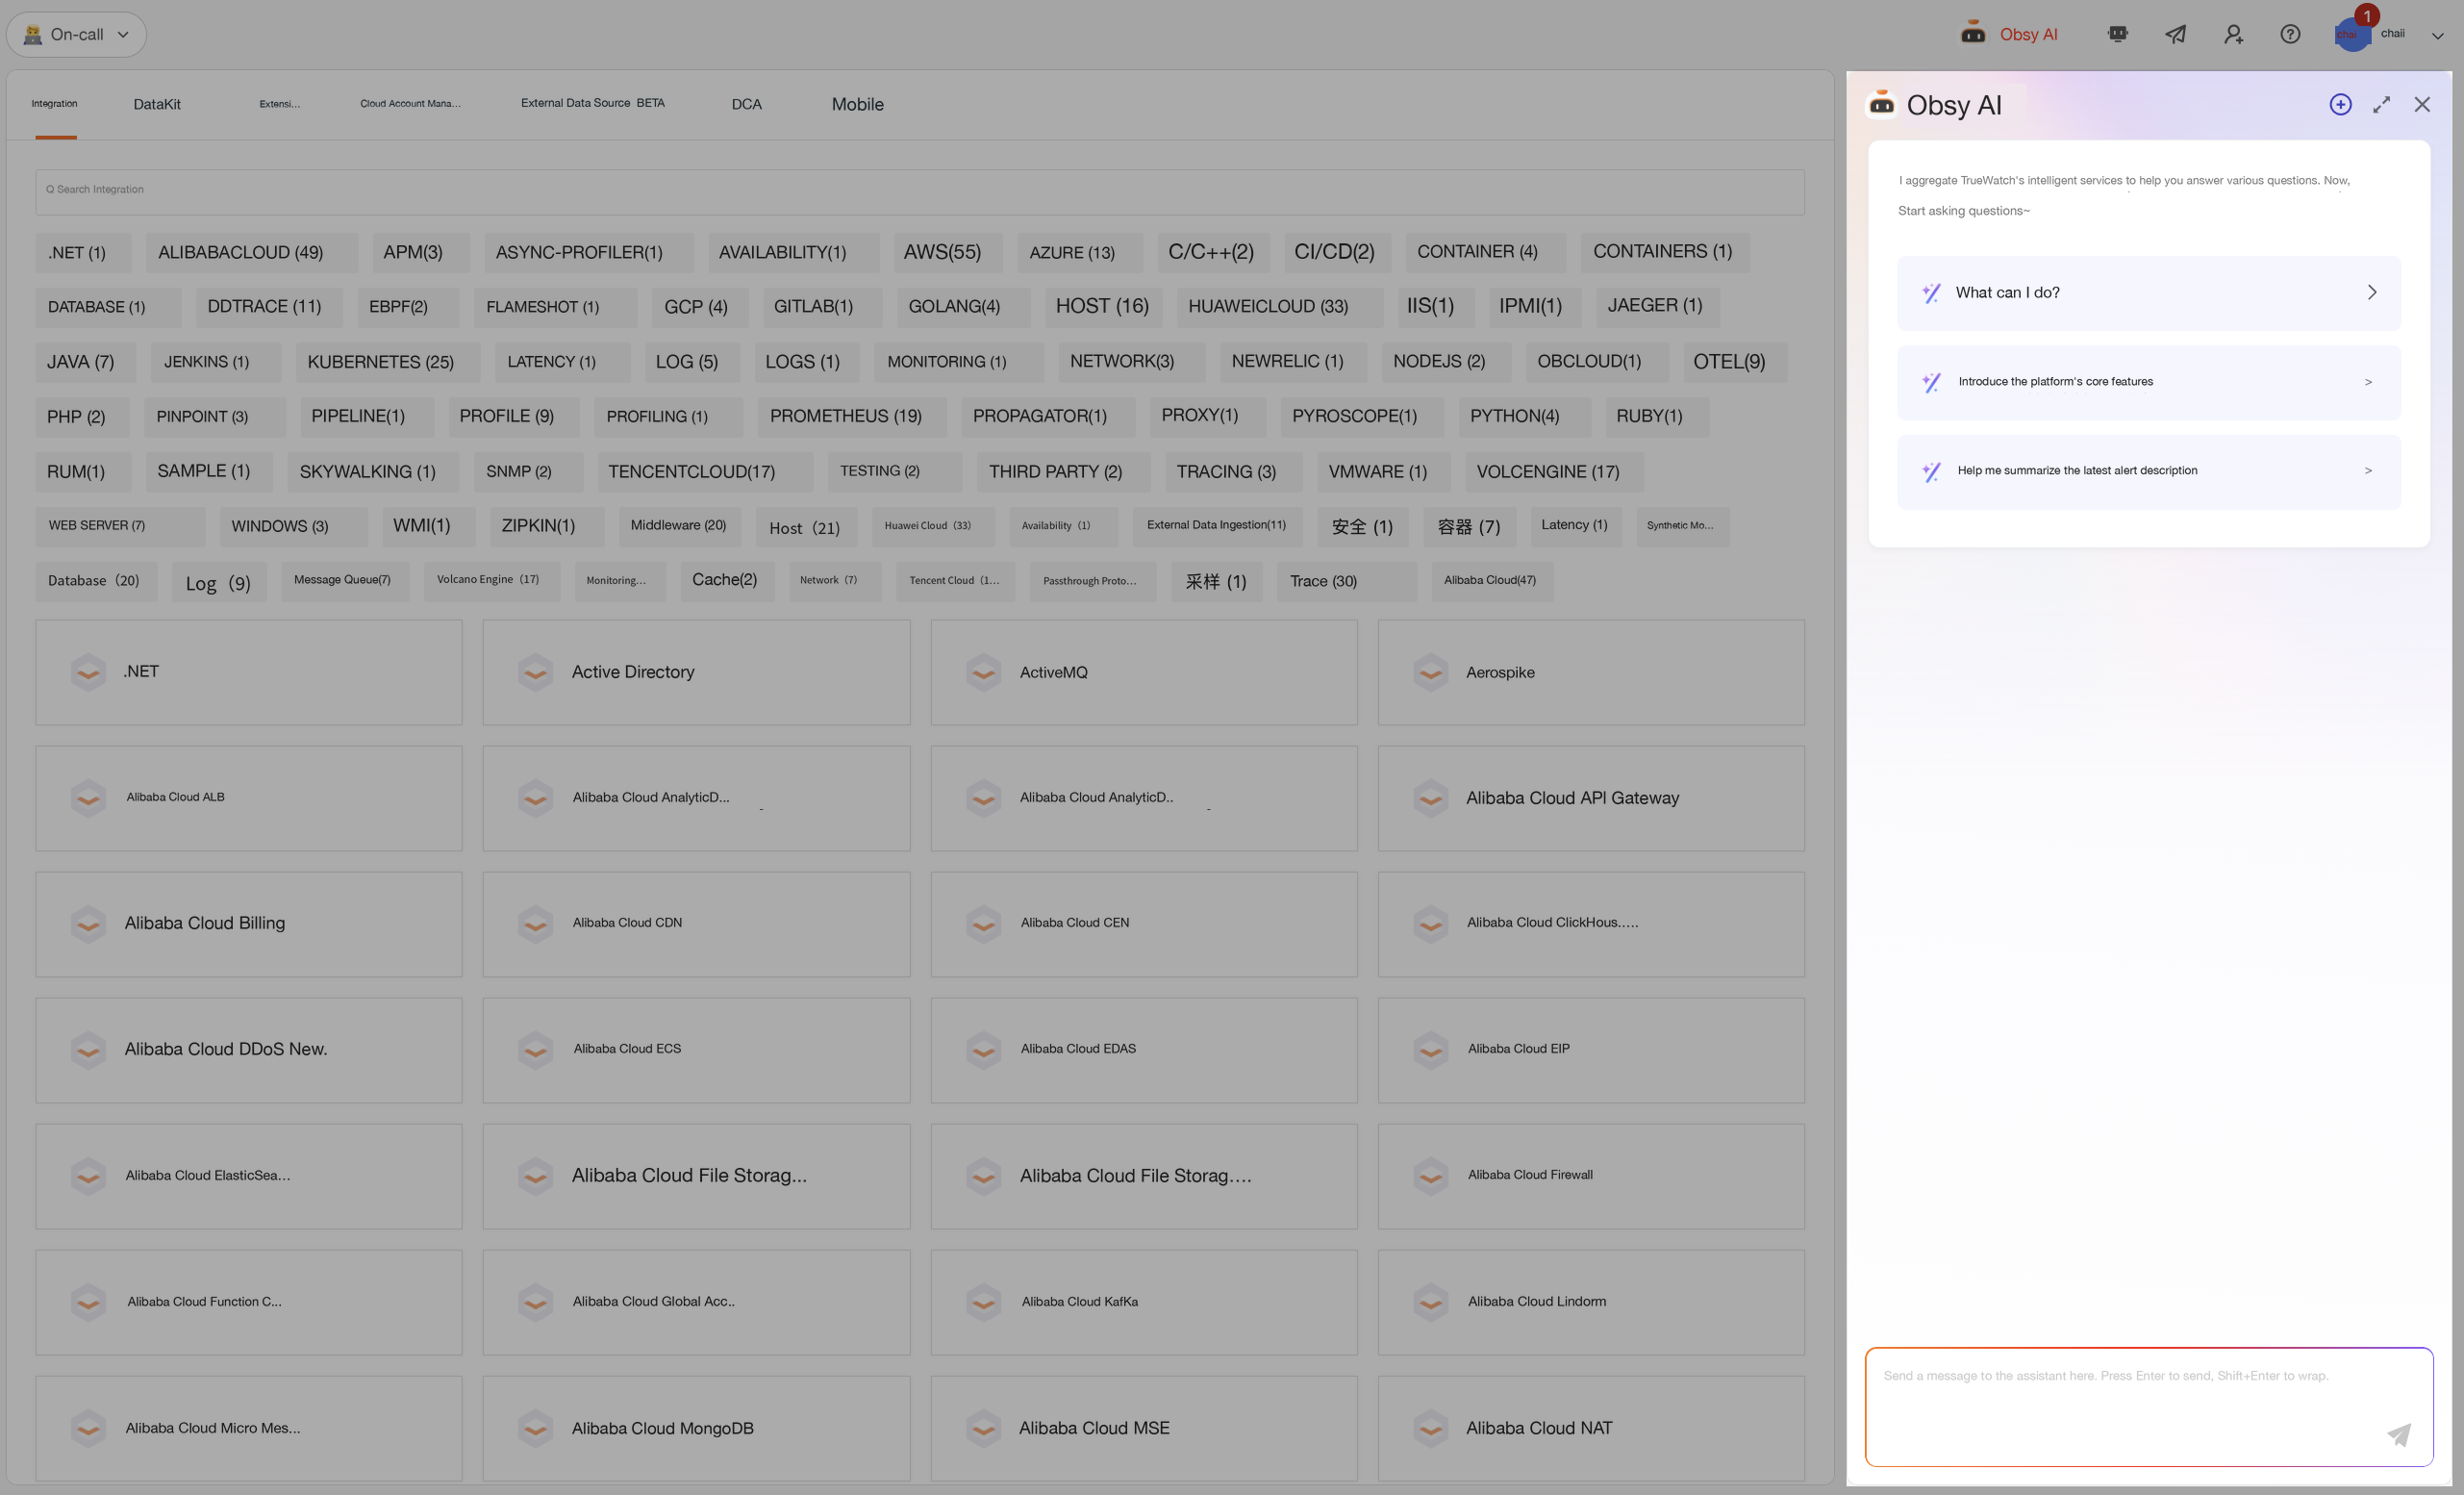
The drawer supports the following operations:
- New Conversation: Click the
+button to start a brand new conversation session. - Enlarge/Shrink: Click the enlarge icon to expand the drawer to full screen, making it easier to view complex content. Click again to restore the default width.
- Close: Click the close icon to collapse the drawer. The current conversation content will be retained.
Quick Questions
When opening for the first time or starting a new conversation, the conversation window displays a welcome message and quick question buttons, supporting one-click sending:
- What can you do?
- Introduce me to the platform's core features
- Help me summarize the latest alert description
Quick Analysis Hints
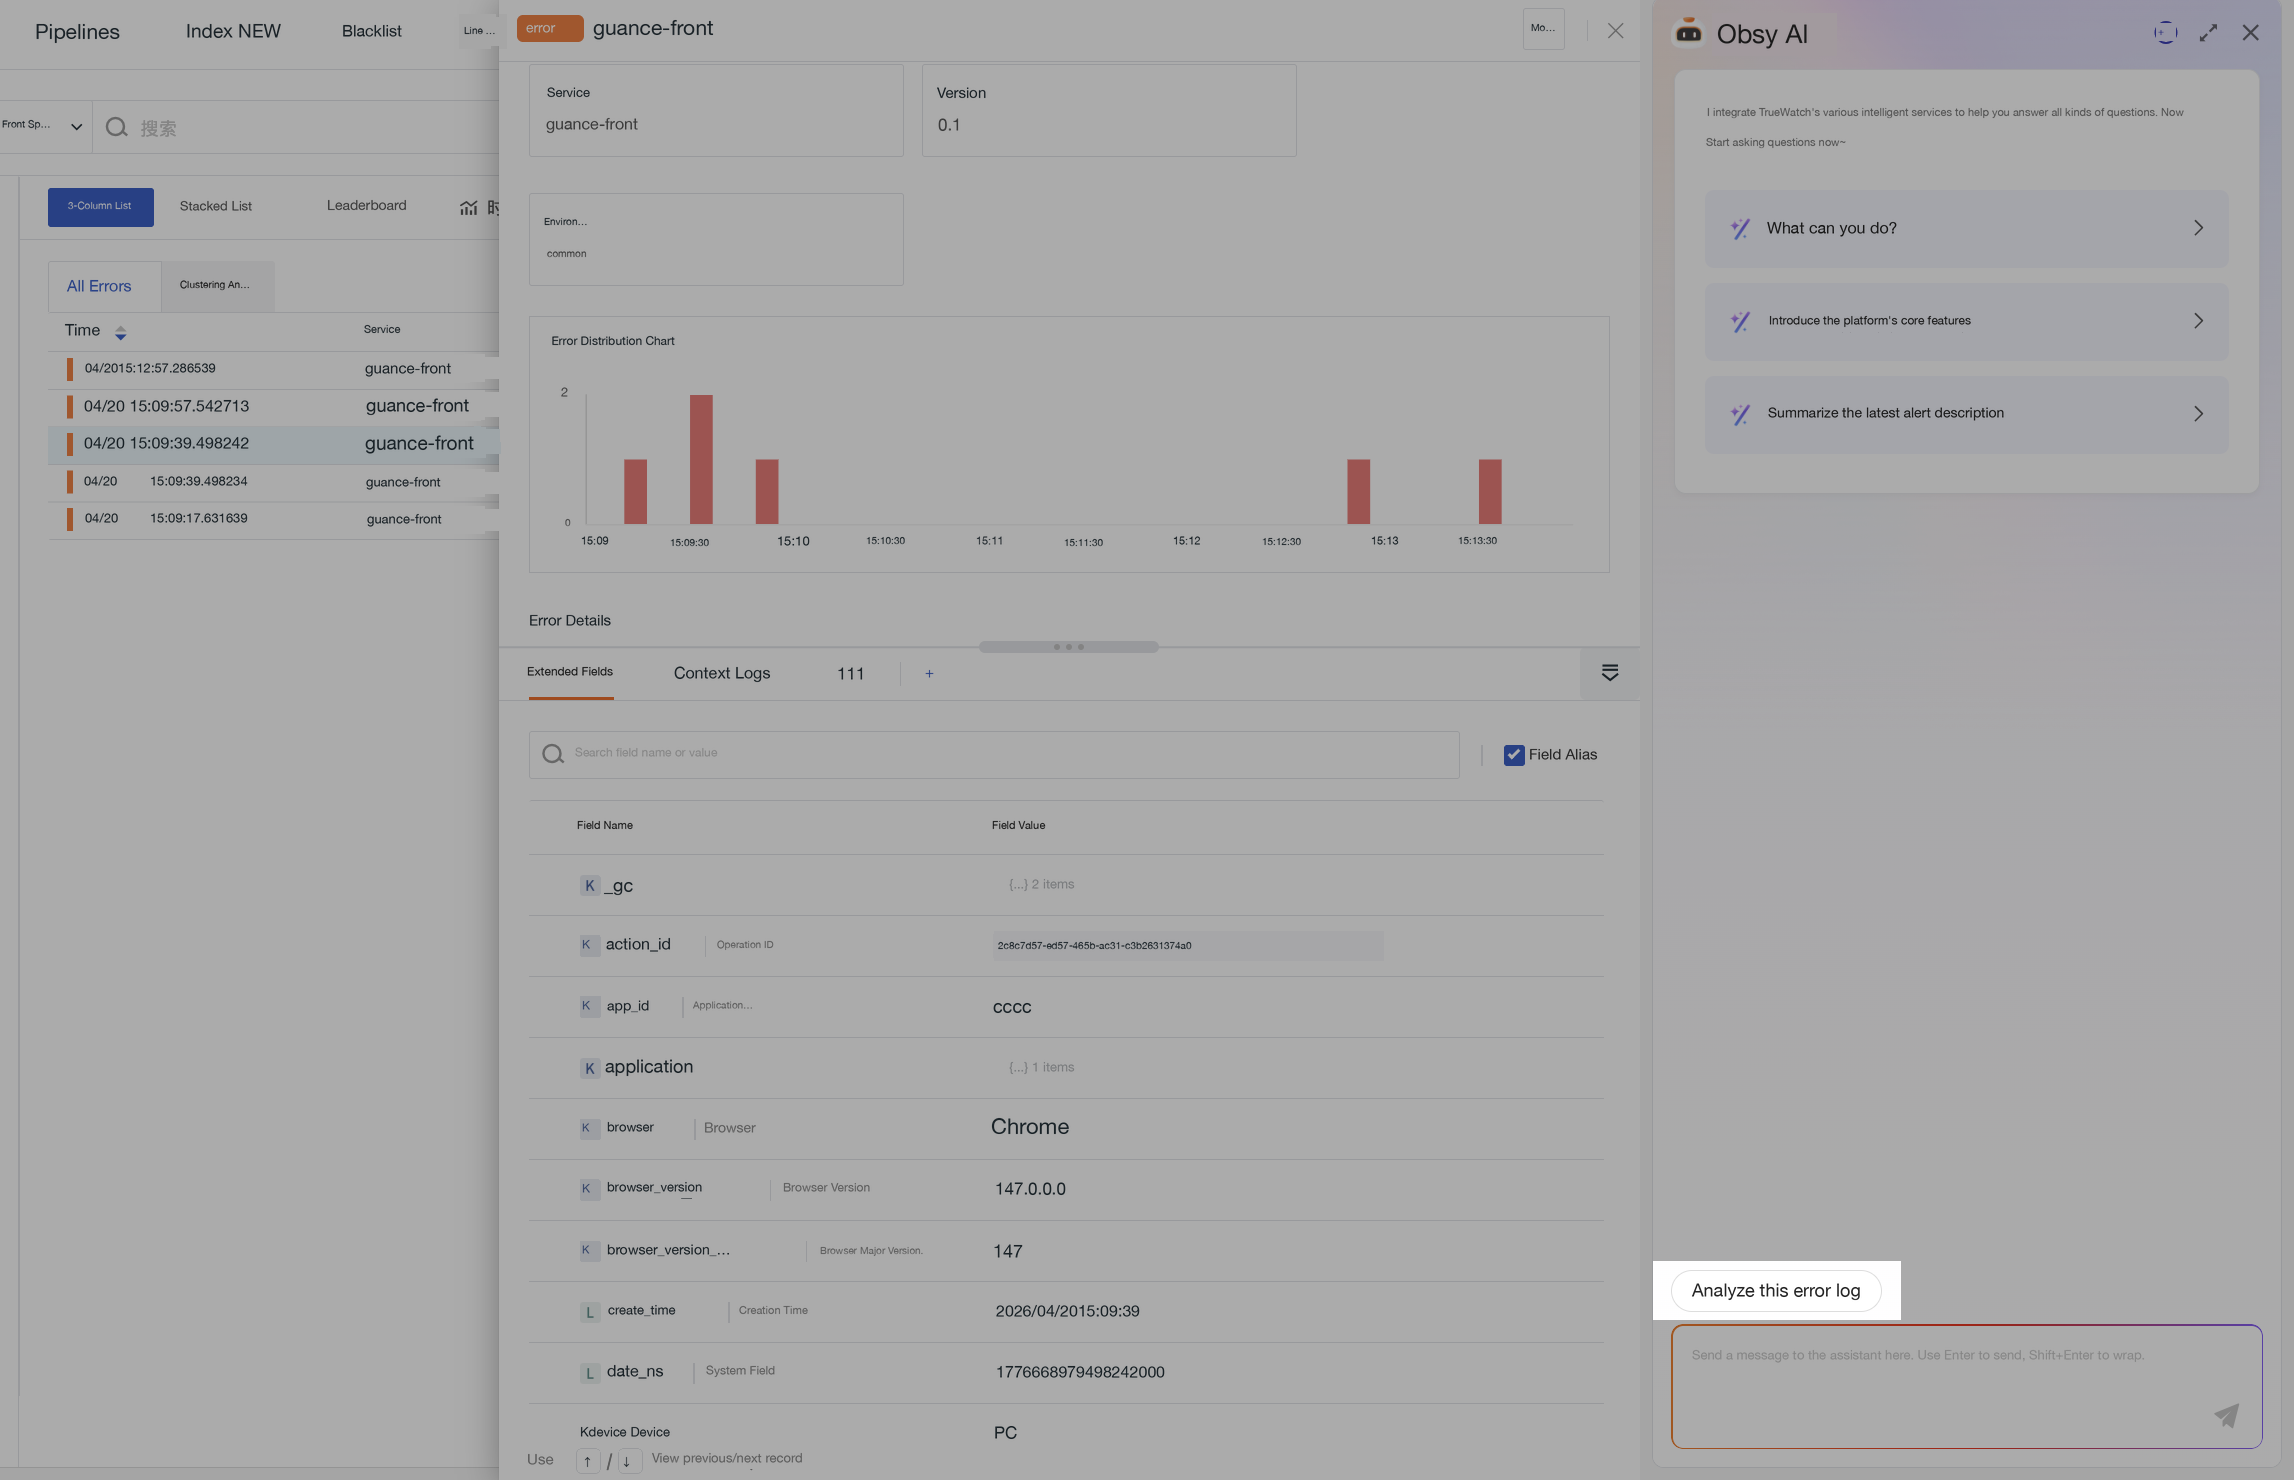
When opening TOBY AI on the following object detail pages, a corresponding quick analysis hint will appear above the input box. Click to send directly:
| Object | Hint Text |
|---|---|
| Error Log Details | Analyze this error log |
| Alert Event Details | Analyze this alert |
| Single Dashboard | Check this dashboard |
| Error Trace Details | Analyze this abnormal call chain |
| RUM Error Details | Analyze this error |
Note
The hint automatically disappears when you start typing any character, send other content, switch objects, or close the panel. The same object is only hinted once per panel session.
AI-Generated Dashboards
TOBY AI supports generating dashboards through natural language, following the standard flow: "Input requirement > Return draft > User modification > Confirm generation > Save".
Trigger Methods
You can enter the TOBY AI dashboard creation process through the following methods:
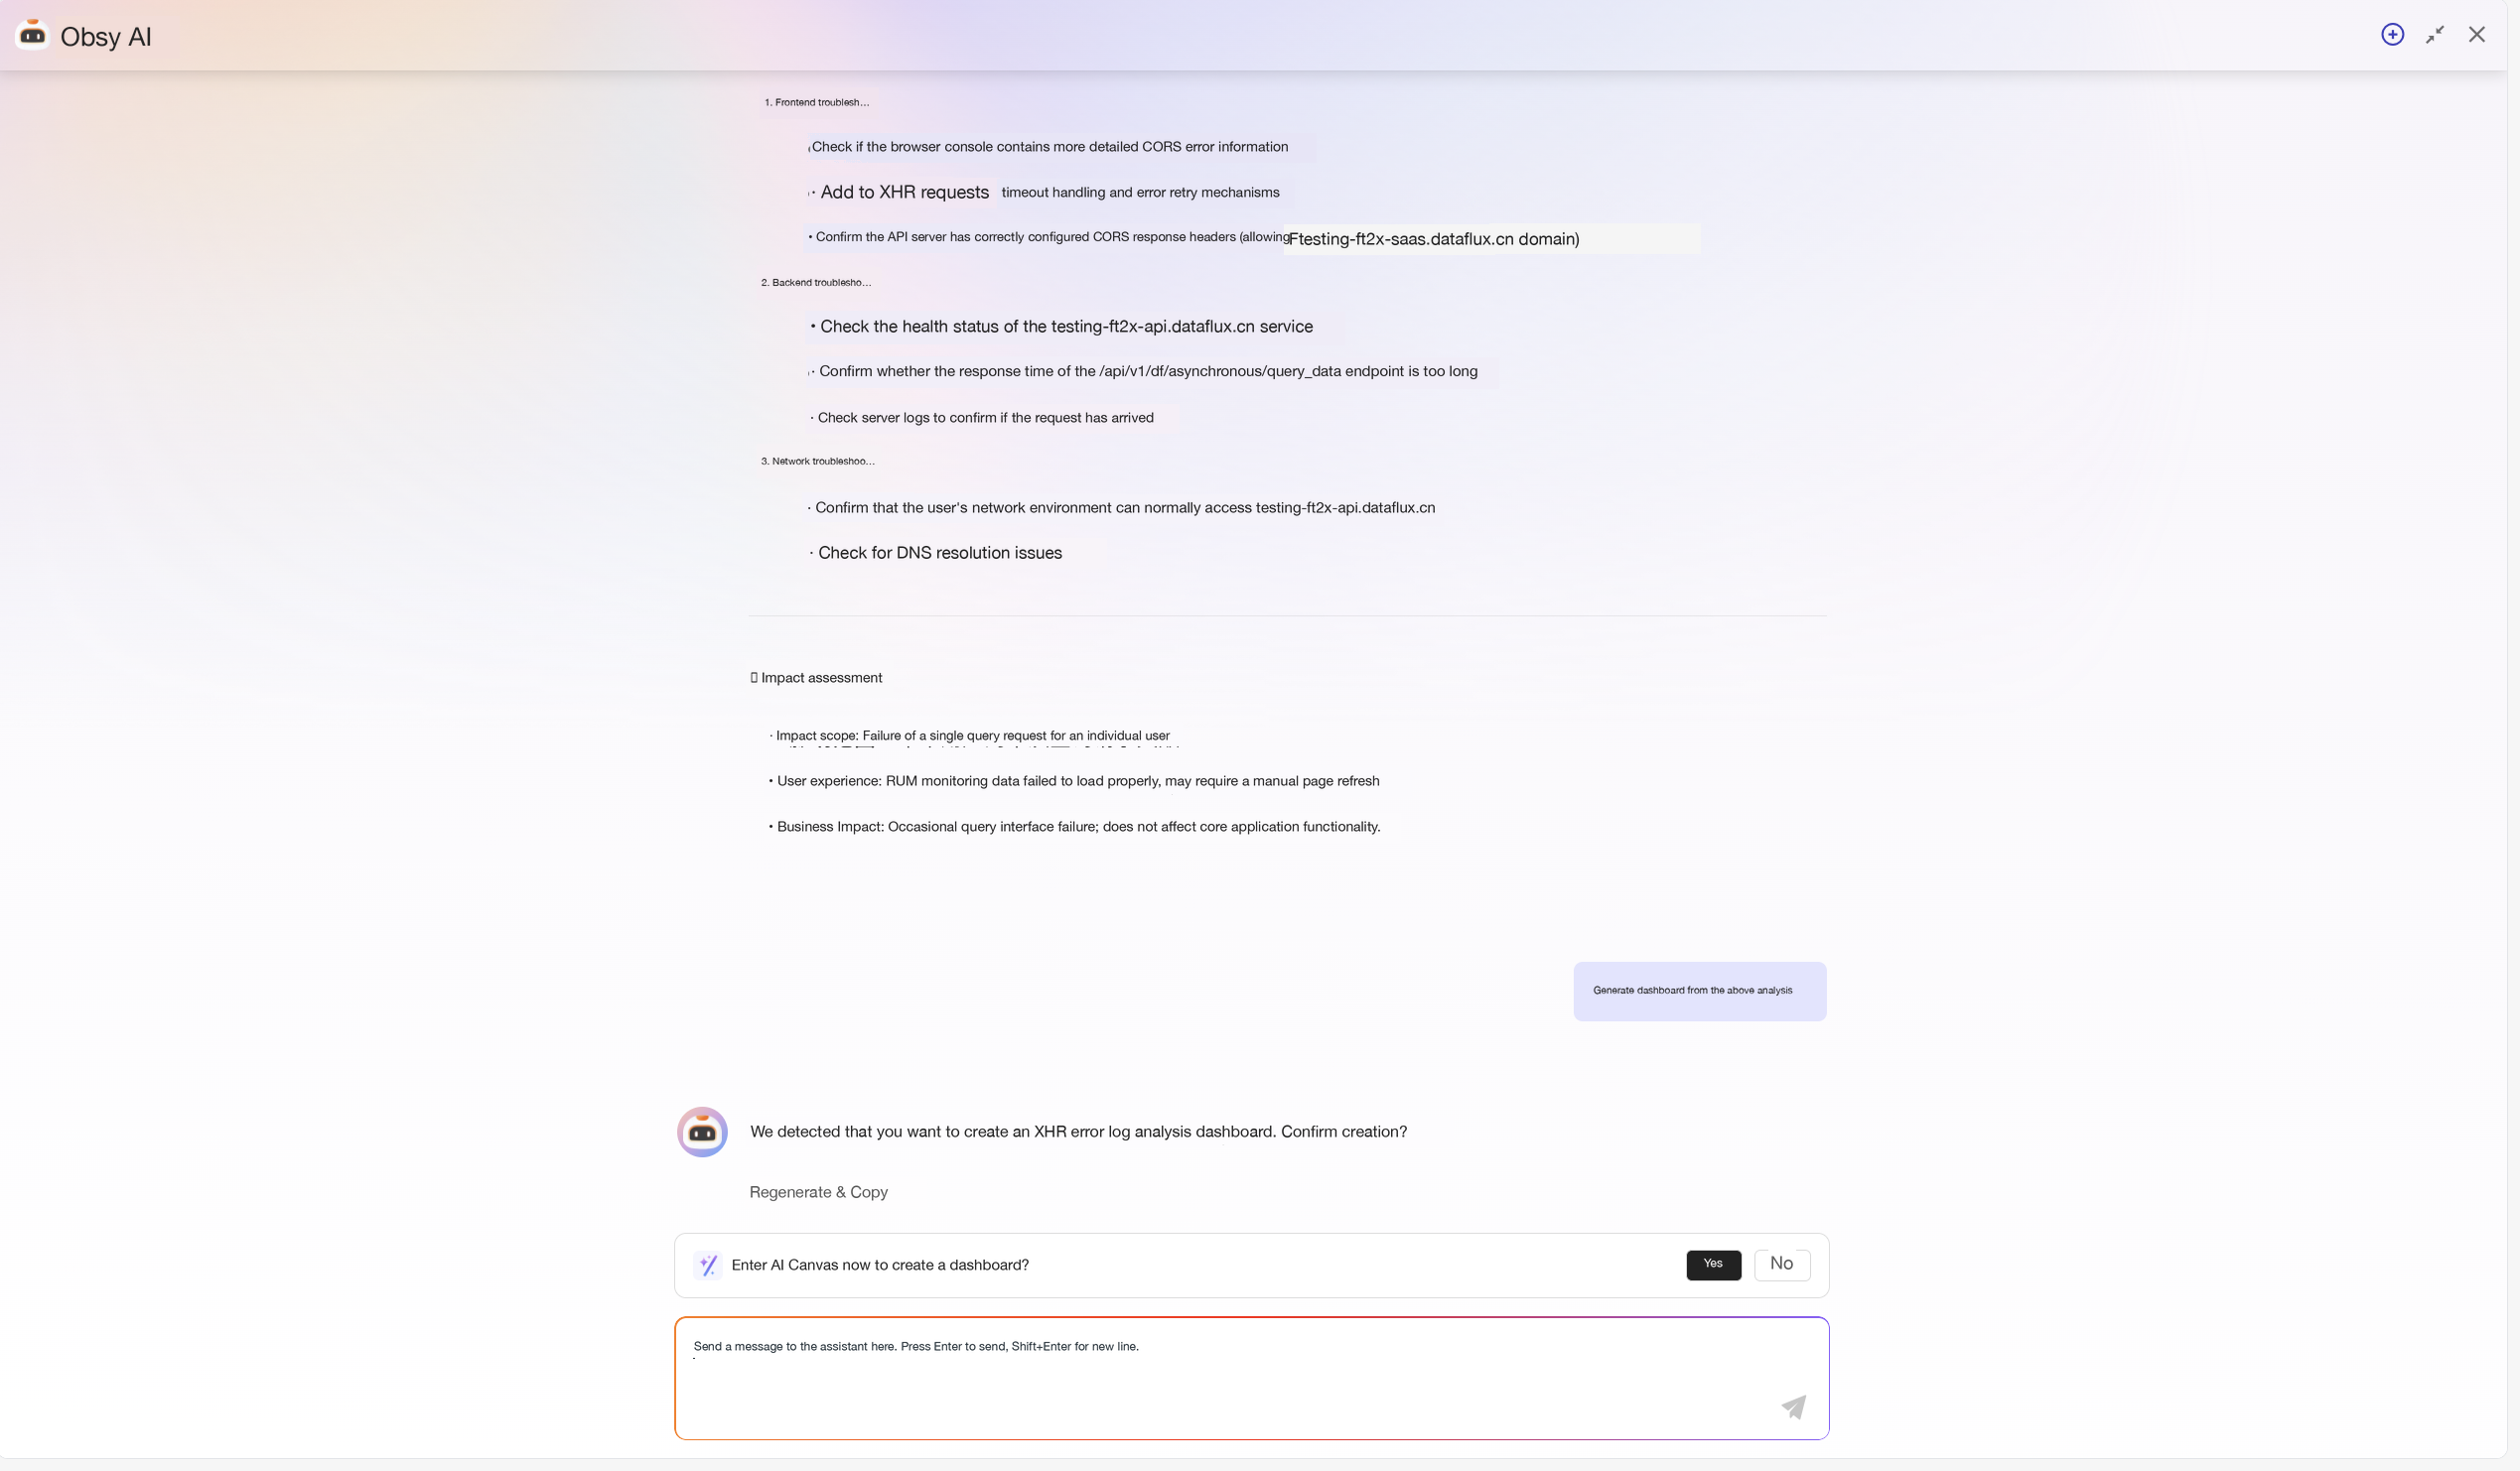
- In the conversation, explicitly express "generate a dashboard from the above analysis" or input a dashboard creation command.
- After TOBY AI recognizes the intent, a confirmation prompt "Do you want to immediately enter the AI canvas to create a dashboard?" will pop up above the input box.
- Select Yes to invoke the creation process.
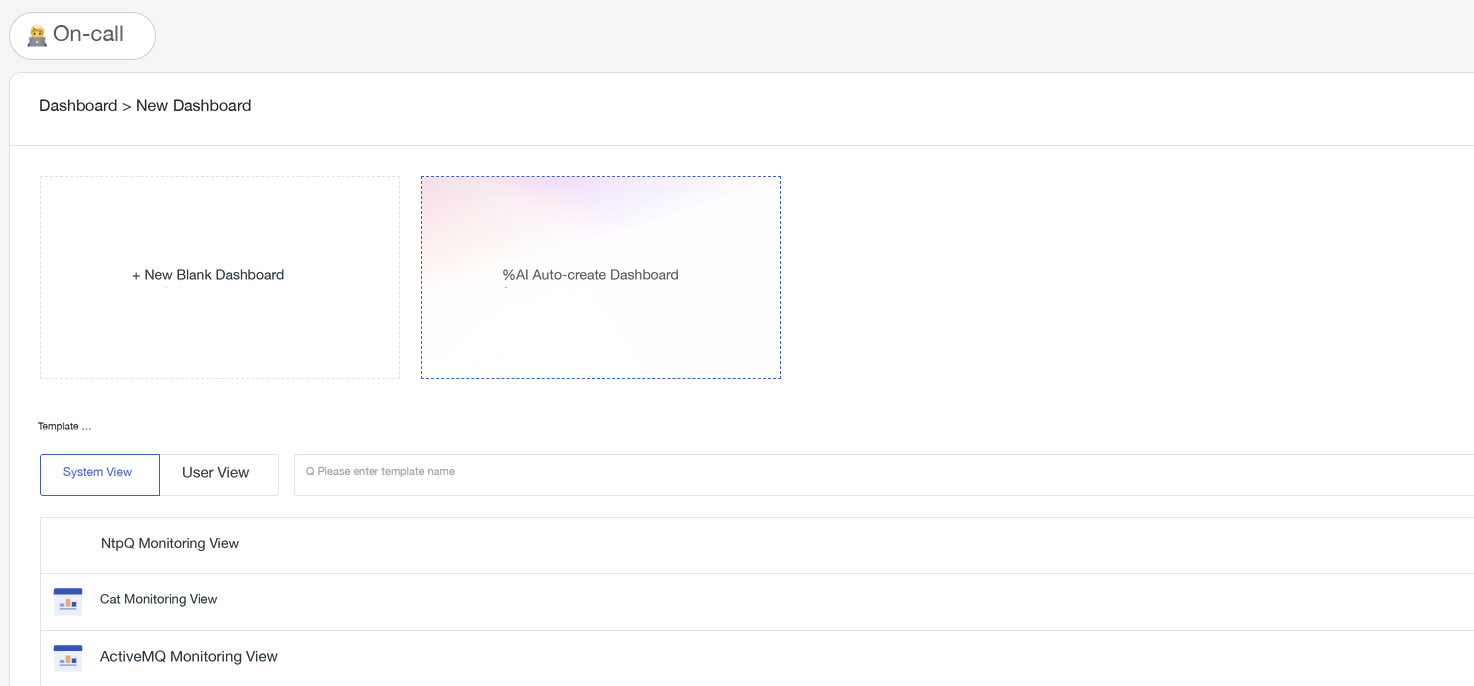
- After entering Scene > Dashboard > Create Dashboard.
- Select AI Auto-Create Dashboard.
Draft Stage
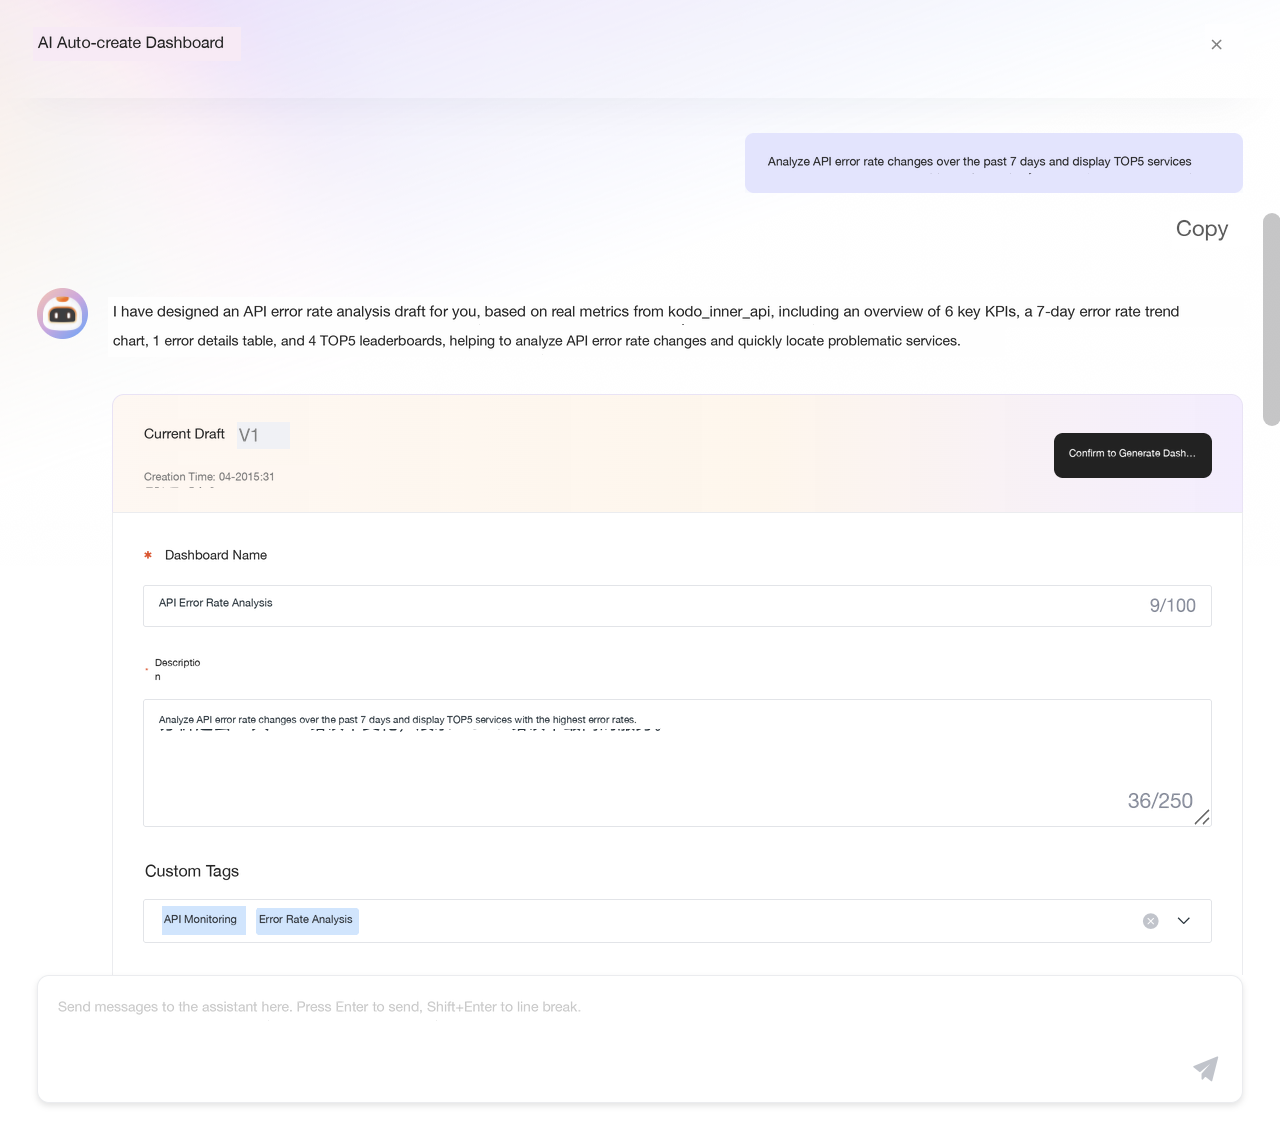
After entering the creation process, TOBY AI generates a dashboard draft based on your natural language description, containing the following areas:
- Draft Information: Displays the current draft version (e.g., V1), creation time, and a one-sentence overview generated by AI.
- Metadata Editing: Supports editing the dashboard name, description, custom tags, and visibility scope (public, visible only to self, custom).
- Chart Drafts: Displays chart cards grouped by modules (e.g., Overview, Trend Analysis, Error Details, etc.). Each card shows the chart title and a schematic graphic.
During the draft stage, you can continue the conversation with TOBY AI via the bottom input box to adjust requirements (e.g., "change the line chart to a bar chart", "add a chart for CPU load"). After confirming everything is correct, click Confirm Generate Dashboard at the top to enter the preview stage.
Preview Stage
After clicking confirm, you enter the Preview Dashboard page. The dashboard is not yet saved in this state.
The top of the page shows the generation status, including the number of completed charts, progress percentage, and a progress bar. Charts are dynamically generated grouped by modules, displaying "Queued for generation" during the process.
After all charts are generated, the Save Dashboard button becomes active. If some charts fail to generate, the page will prompt "Some charts failed to generate, please return to the AI conversation to regenerate."
- Immediate Correction: After generation ends, you can directly adjust charts on the preview page.
- Return to AI Conversation: The Return to AI Conversation button in the top right corner of the page allows you to go back to the dialog to redefine requirements.
Draft Recovery
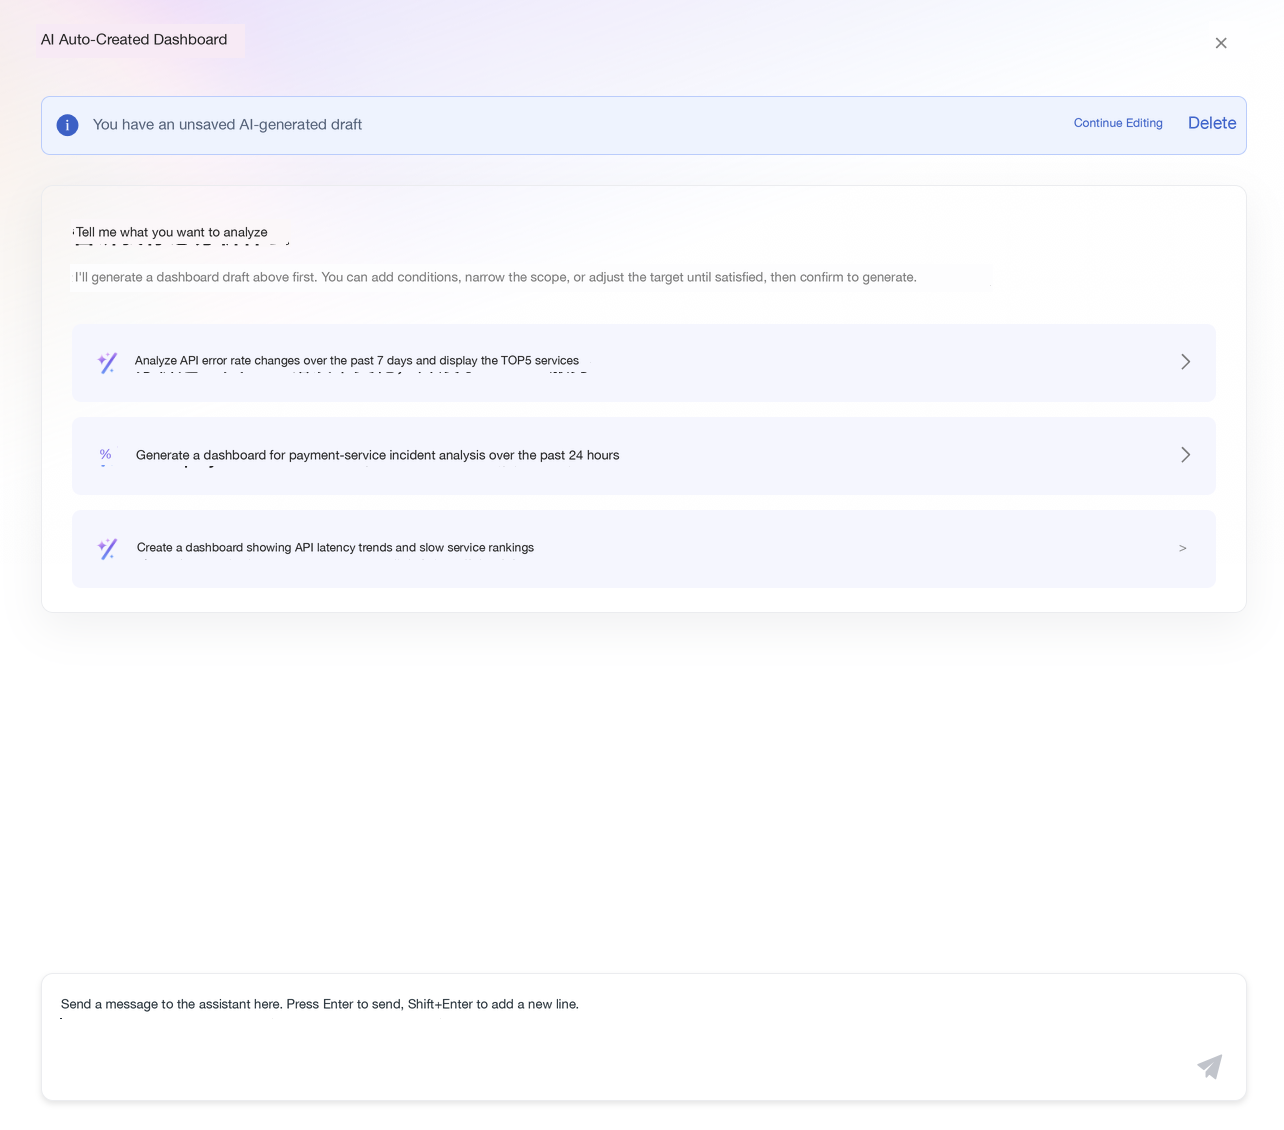
If you exit during the draft stage, when you click Create Dashboard again, the TOBY AI auto-create card will display a Draft prompt. You can choose:
- Continue Last Creation: Restore the previous version's conversation flow and draft content.
- New AI Creation: Clear the cache and start a brand new process.
Dashboard List Management
On the Dashboard List page, dashboards generated by TOBY AI will automatically have an AI identifier appended.
