DATABASE
The DATABASE view covers various infrastructure database data supported by DataKit collection. Through a centralized explorer, it provides real-time monitoring of key metrics for databases such as MySQL, SQL Server, PostgreSQL, and Oracle, including version, uptime, load trends, and blocking rates.
Note
The DataKit collector has been updated. Please contact your administrator to upgrade the version to enable the new database monitoring experience.
Data Display
The DATABASE explorer provides multiple professional analysis views based on lists and charts.
Displays the latest metric data for the corresponding databases in the current workspace, including database name, database type, version, uptime, QPS, load trends, blocking rates, and other data.
Displays data in chart forms such as Top List, pie charts, treemaps, and grouped table charts, based on count, last, first, count_distinct operation modes, with data filtered under by conditions.
Data List
Time Widget
In the upper right corner of the explorer, you can select data for different time ranges, including:
- Last 2 hours
- Last 6 hours
- Last 1 day
- Last 2 days
Data Details
Click on a single data entry in the DATABASE explorer to slide out the corresponding details page. You can view scattered data for that entry, such as Overview, Query, Session, Metrics, Log, and custom associated views, avoiding the need for repeated navigation and queries.
Overview
The Overview page displays the core operational status of the database instance. The top of the page shows the instance name, version, uptime, slow query log status, and host information, helping you quickly locate the infrastructure resource where this database instance resides.
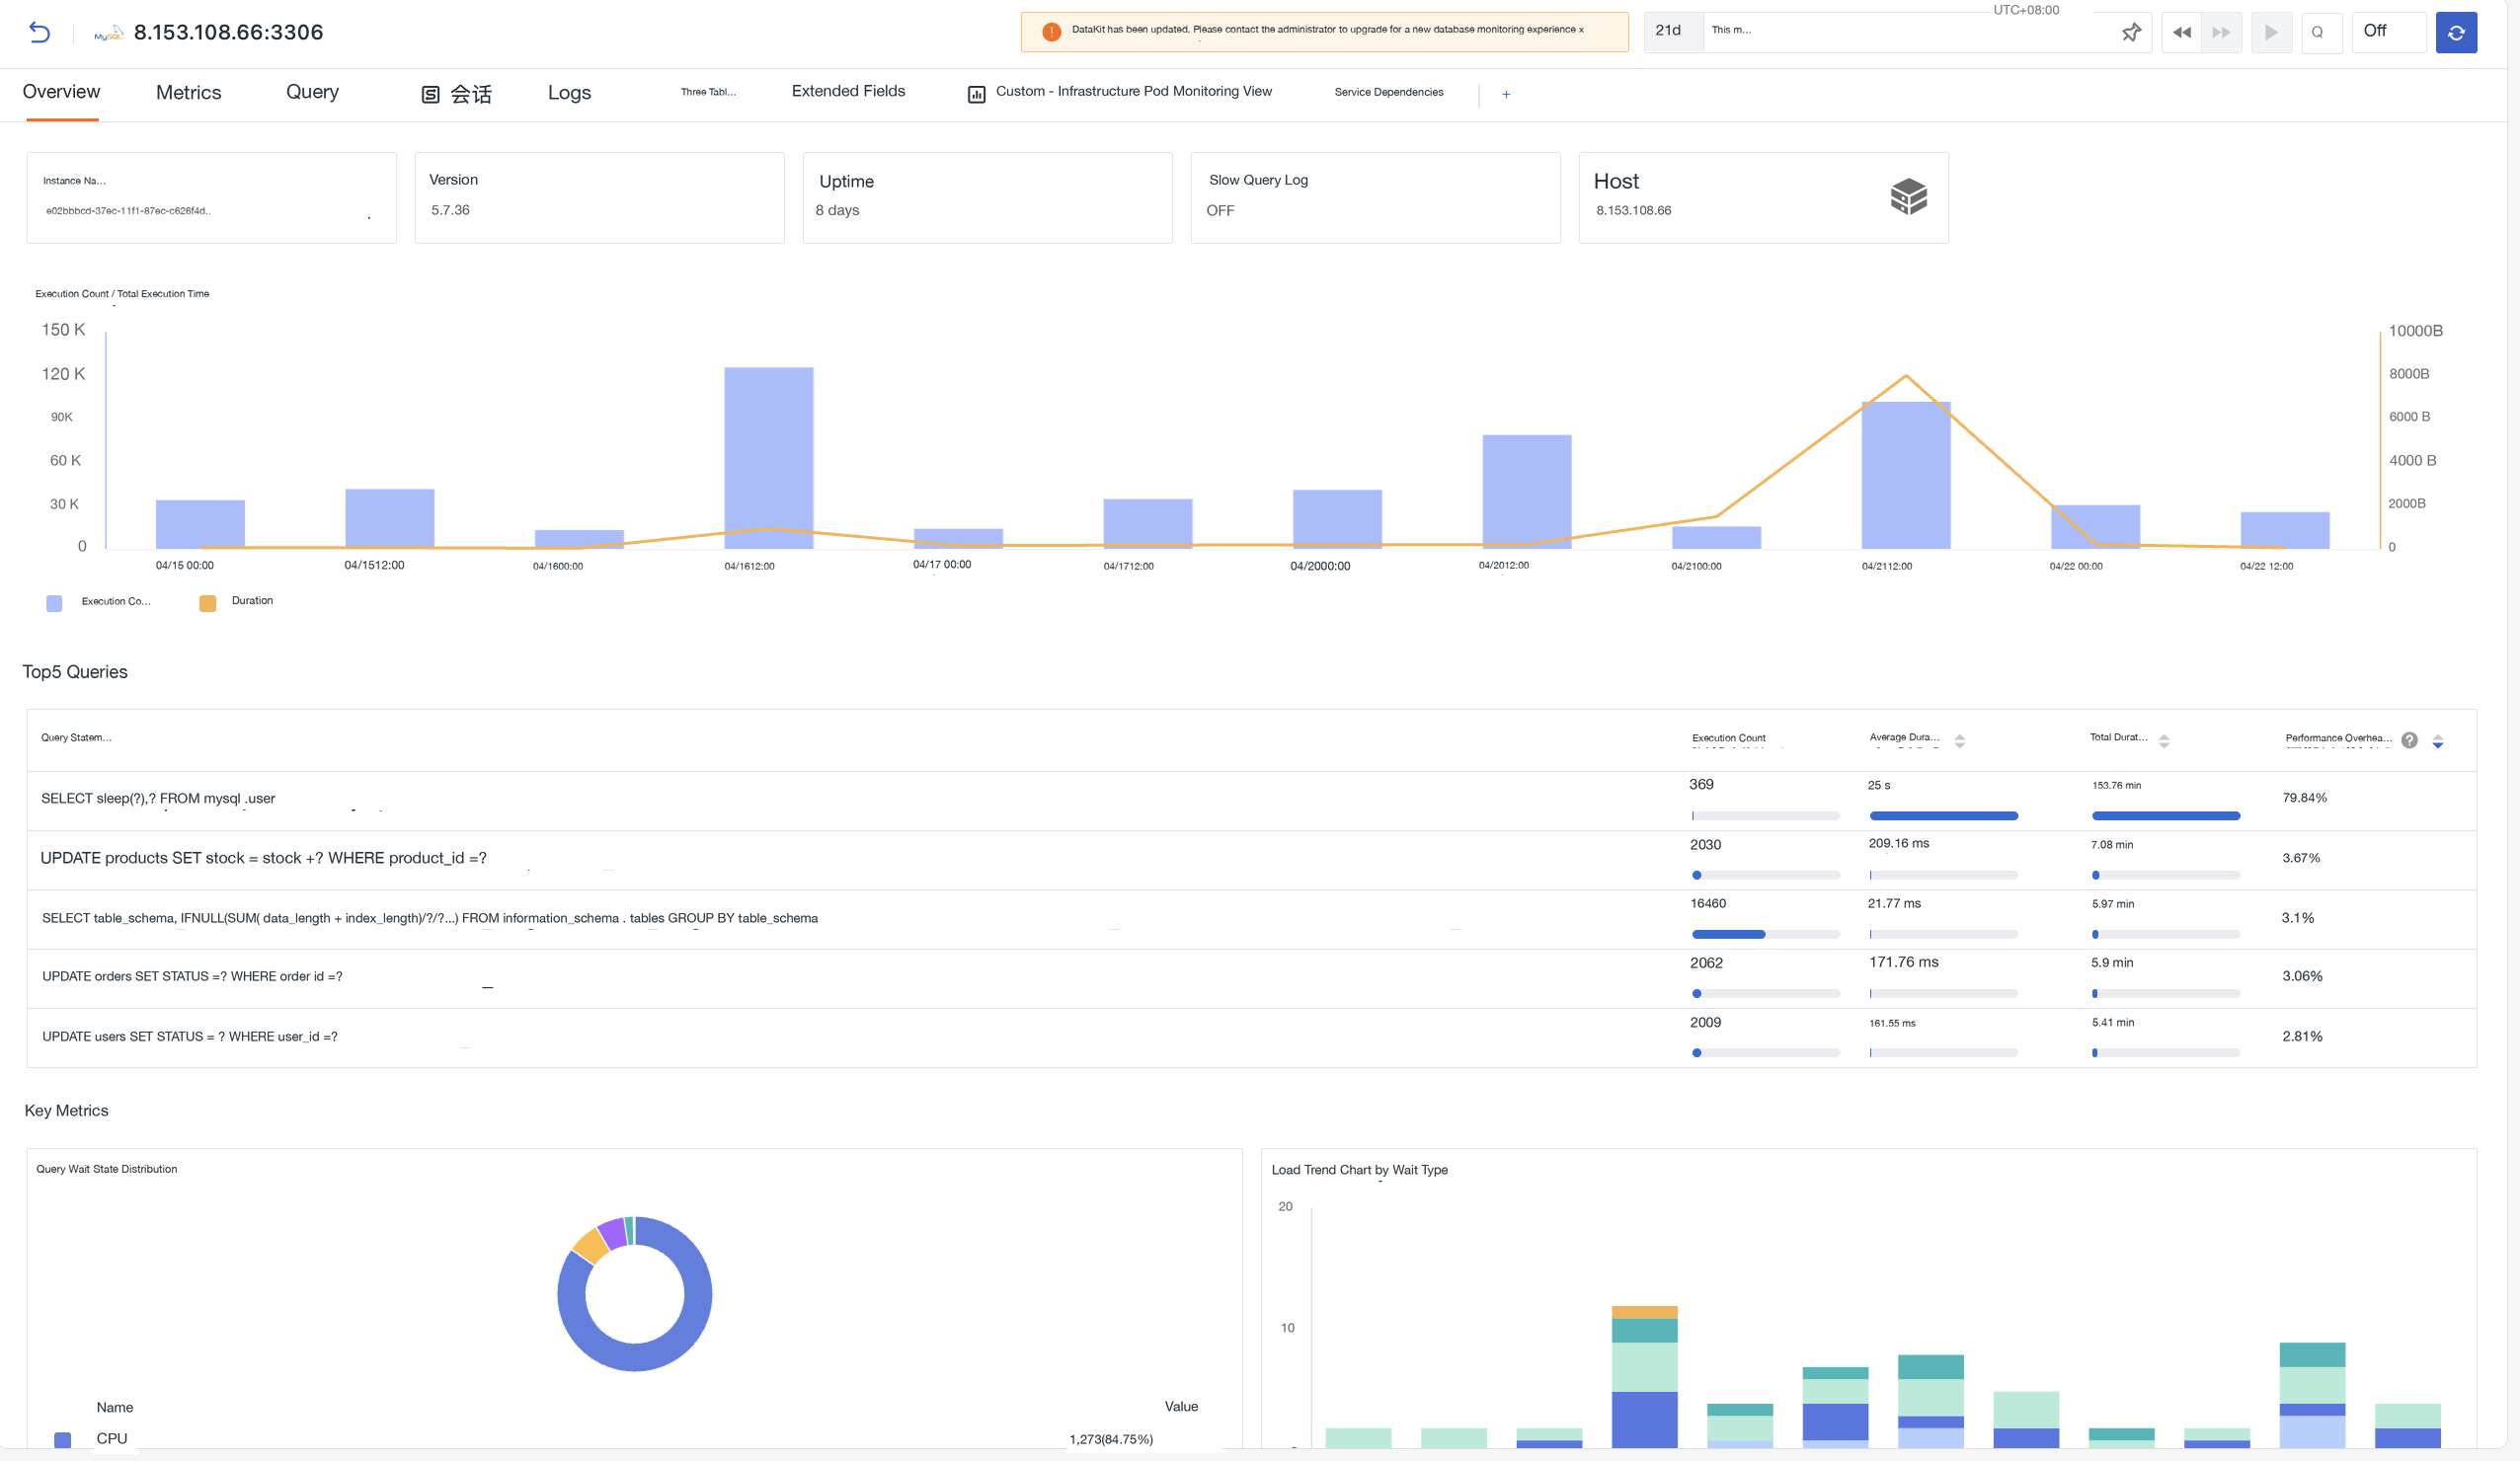
Execution Count / Total Execution Time
The left Y-axis uses a bar chart to display the total number of query executions within the time interval, and the right Y-axis uses a line chart to display the total execution time of all queries within the time interval.
Top 5 Queries
Displays the top queries sorted by total execution time, including the query statement, execution count, average execution time, total execution time, and performance cost percentage. Click on any query to enter the Query Overview slide-out page for details.
- By default, sorted in descending order by total execution time.
- Click on any row to enter the Query Overview slide-out page.
Key Metrics
1. Query Wait State Distribution
Displays the distribution of wait events for current database sessions in a donut chart, aggregated by wait state dimension.
2. Load Trend Chart by Wait Type
A bar chart displays the database load distribution by wait type dimension, intuitively showing the proportion changes of various load types such as Idle, CPU, Application, and System I/O.
3. Key Resource Metrics
Displays the core resource consumption trends of the node where the database resides, including:
- CPU: CPU usage, CPU load
- Disk: Disk read/write time, bytes read/written per second, IOPS, disk usage
- Network: Network traffic/sec, network packets/sec
- Memory: Memory usage, memory consumption
Metrics
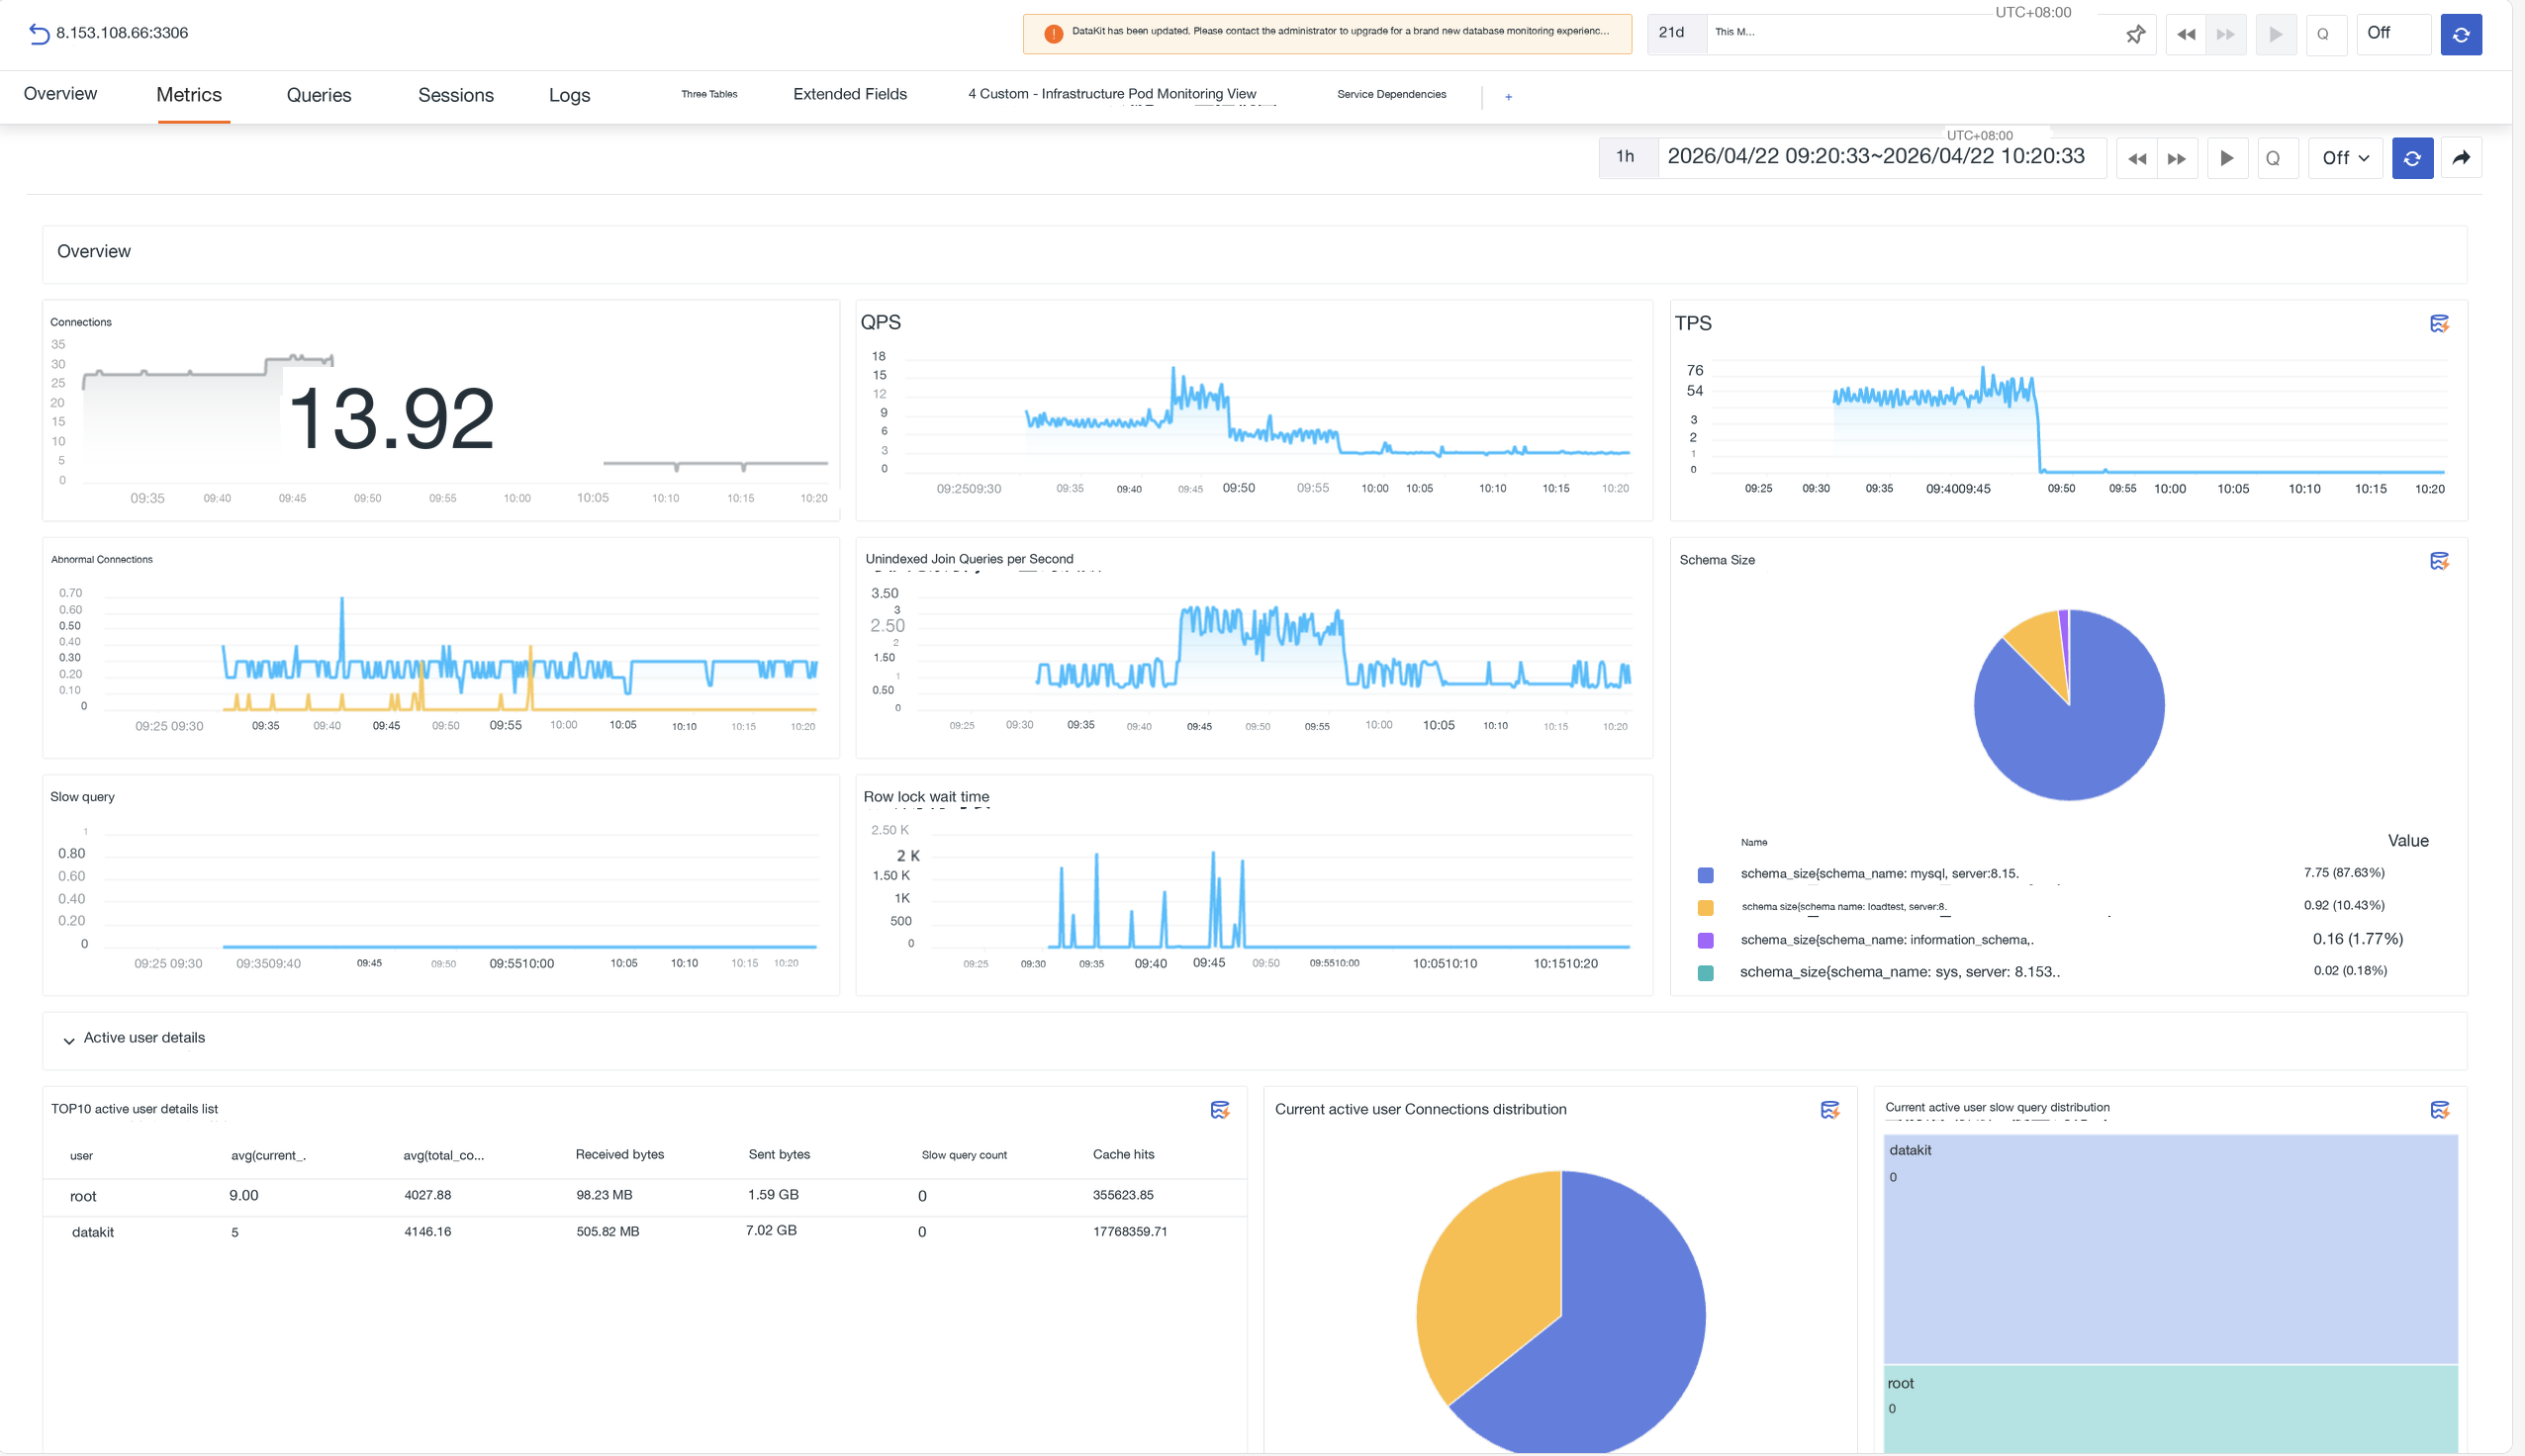
Displays all performance metrics of the database in visual chart forms, including core metrics such as session count, response time, cache hit rate, tablespace usage, and PGA memory.
Query
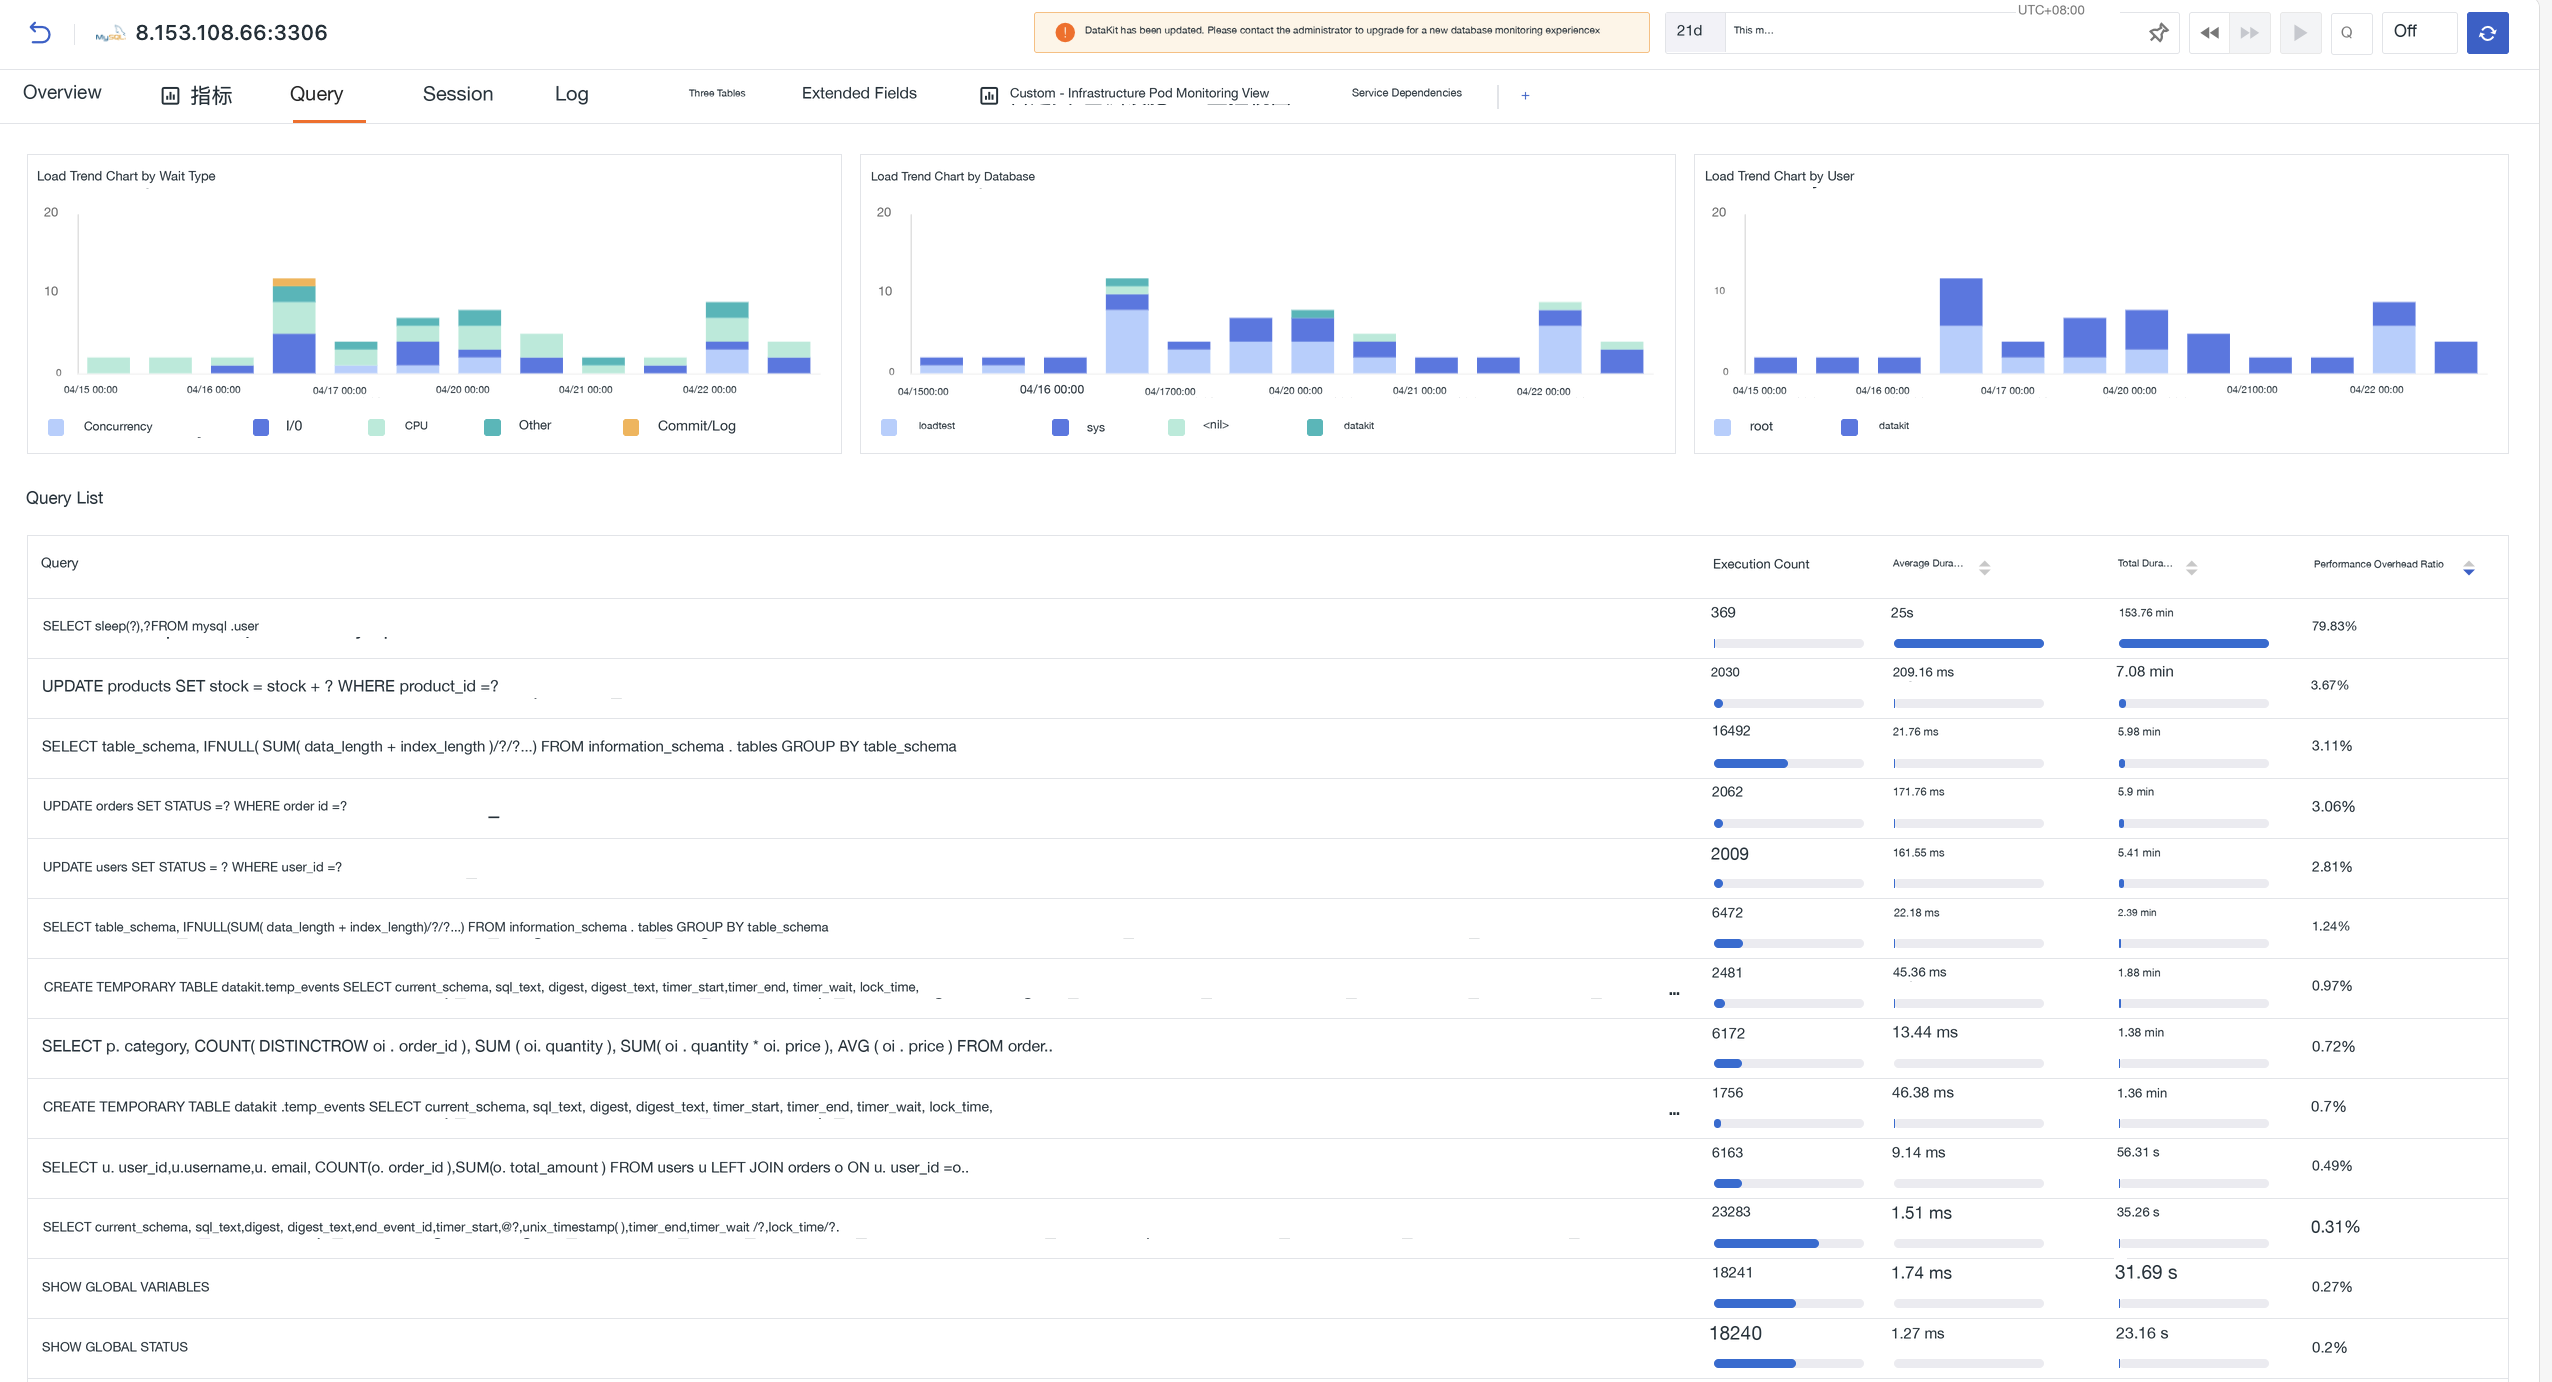
Focuses on SQL performance analysis, helping to locate slow queries and performance bottlenecks.
The top displays load trend charts aggregated by three dimensions: wait type, database, and user. Below is the query list, showing the execution count, average execution time, total execution time, and performance cost percentage for each SQL statement, supporting sorting by various dimensions.
- Click on any query to enter the Query Overview slide-out page, where you can view the SQL statement, performance trend charts, and sampling records.
- Click on a sampling record to drill down to the query details, viewing the complete log data for that sample.
Session
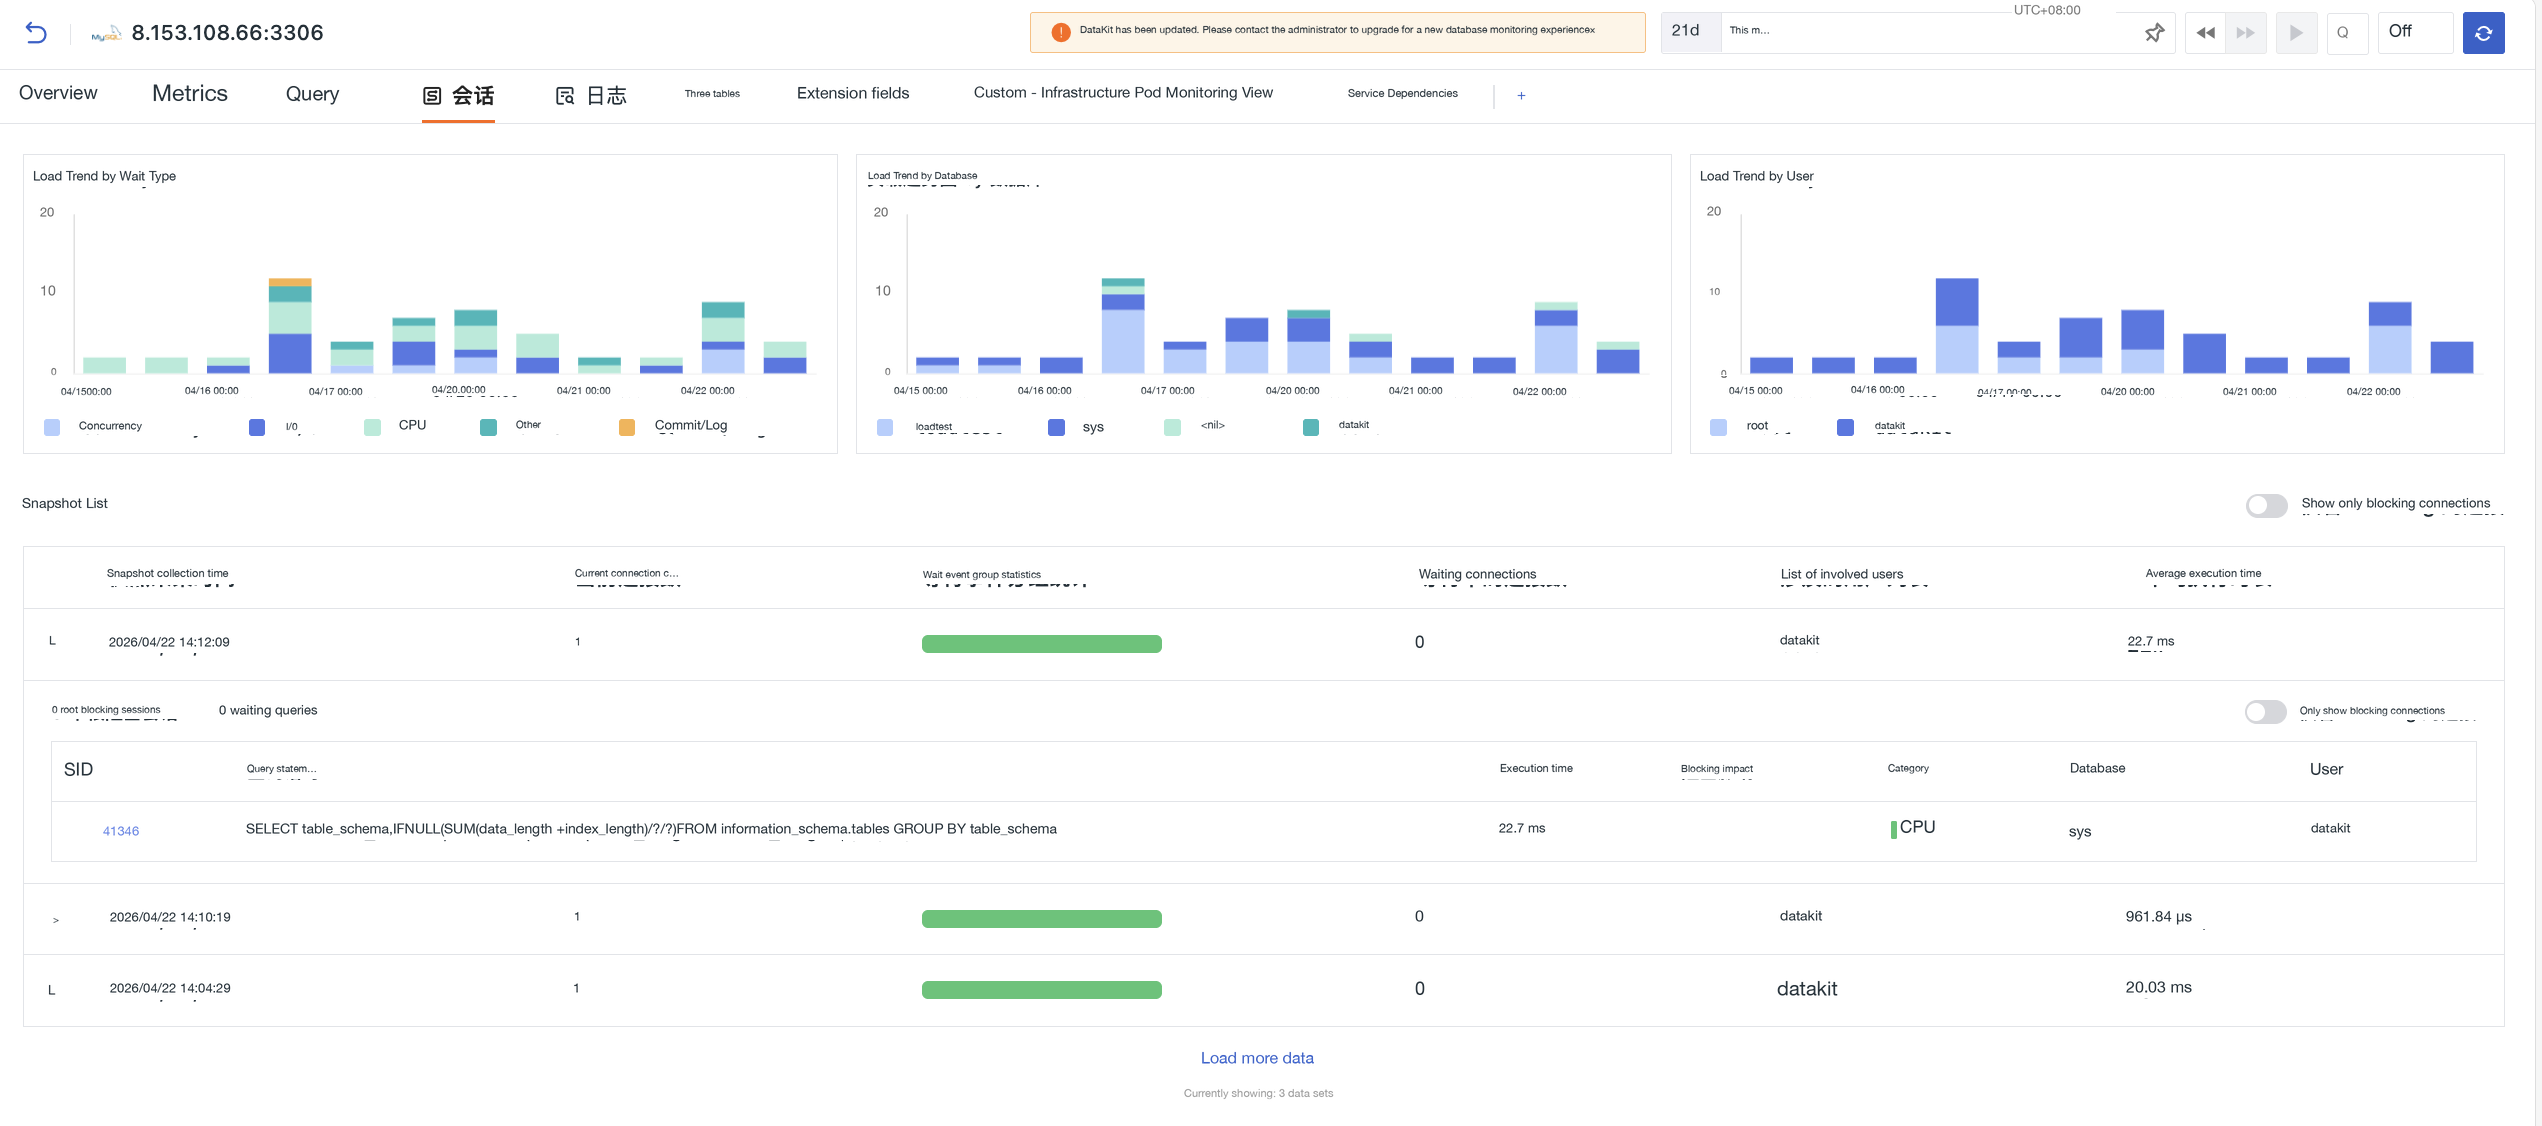
Focuses on connection session, lock wait, and blocking analysis, helping to diagnose concurrency conflict issues.
- The top displays load trend charts aggregated by three dimensions: wait type, database, and user. The vertical axis represents the number of active sessions at the corresponding time point.
-
Below is the snapshot list, which aggregates and displays session data by collection time point, containing key metrics such as current connection count, wait event distribution, number of waiting connections, involved users, and average execution duration.
-
Click on a snapshot to expand and view details. After expansion, it displays statistical summaries of root blocking session count and waiting query count, as well as a detailed session list.
-
Provides a "Show only blocking connections" filter switch:
- Top right corner of the snapshot list: Globally filters snapshots with blocking activity.
- Top right corner after expanding snapshot details: Only displays blocking-related sessions within the current snapshot.
-
Click on a query statement in the session list to further drill down and view detailed SQL performance data.
Log
View log data related to the database, including slow query logs, error logs, etc.
Table
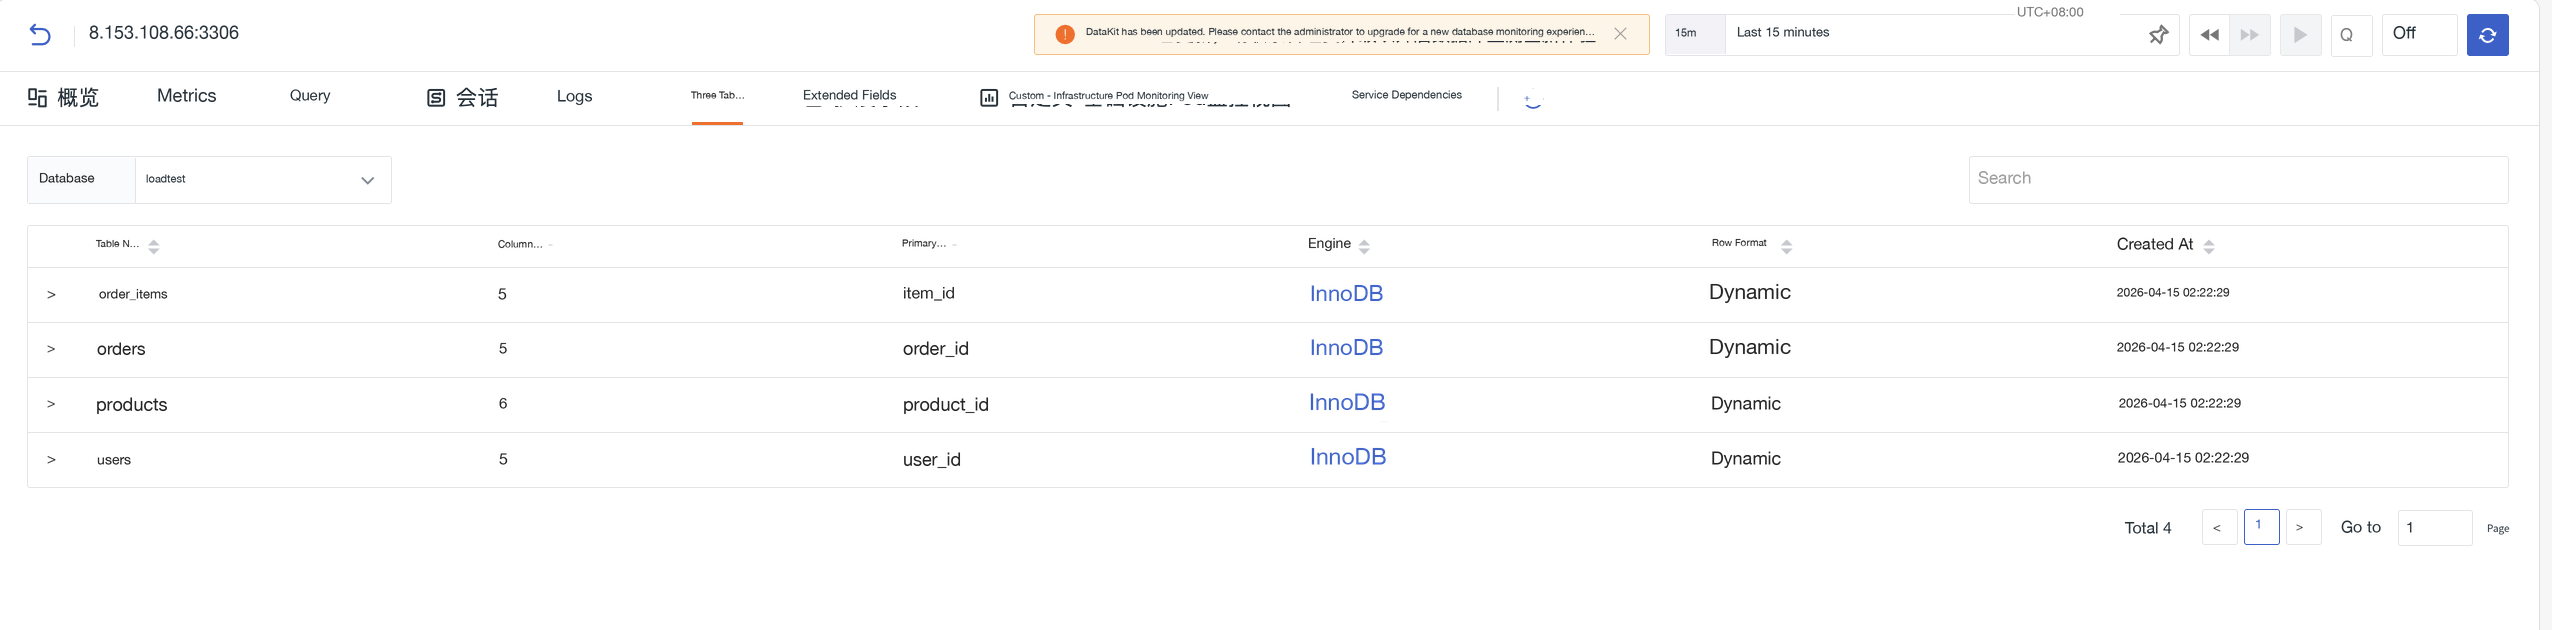
View database table structure information. Switch the target database via the Database dropdown, or search for table names in the search box.
The list displays all tables under the current database, including table name, column count, primary key, engine, row format, and creation time. Click on a table name to expand and view the field structure details of that table.
Extended Fields
Displays the complete metadata of the instance in key-value pair form, supporting searches by field name or value.
Custom Views
Centrally collects user-defined views and supports adding new views.