Page Management
After entering a single dashboard page, you can perform management operations through the top toolbar and the right-side settings panel.
Card Attribute Information
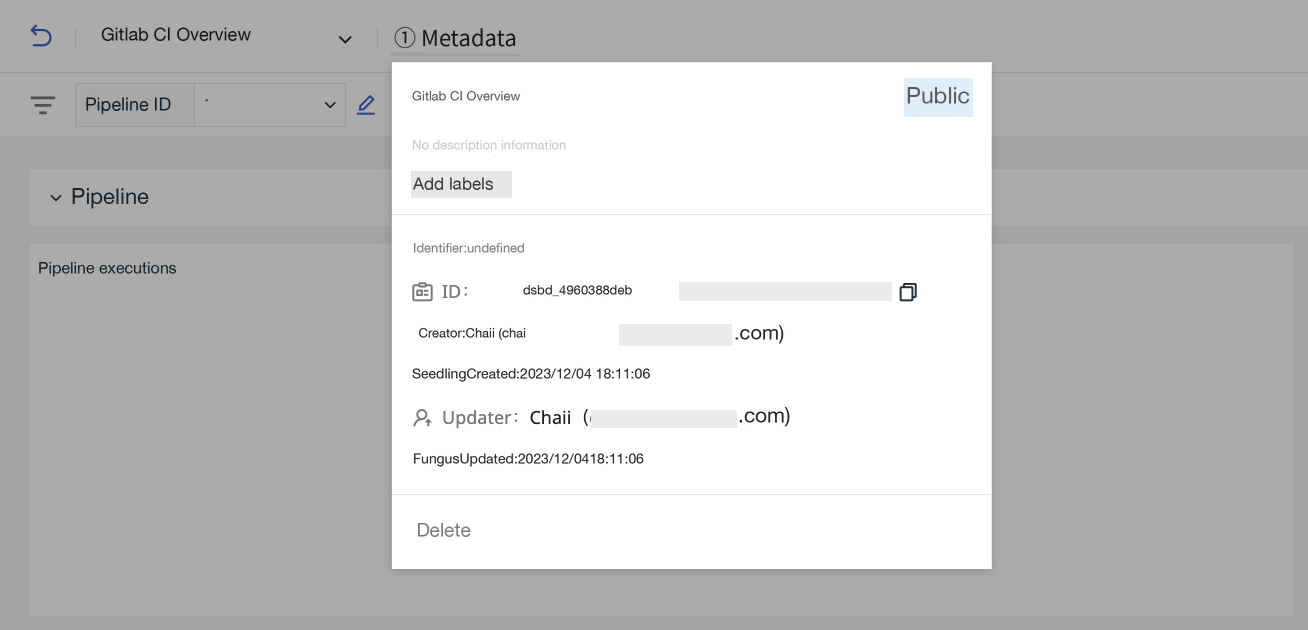
After entering a specific dashboard, view the diagram information at the metadata section above the page. You can view and modify the dashboard's ID, name, description, tags, and visibility scope, and also delete the dashboard here.
Note
If the current dashboard page is saved as a snapshot and shared externally, the shared recipient cannot view the card attribute information here when not logged in.
TOBY AI Intelligent Analysis
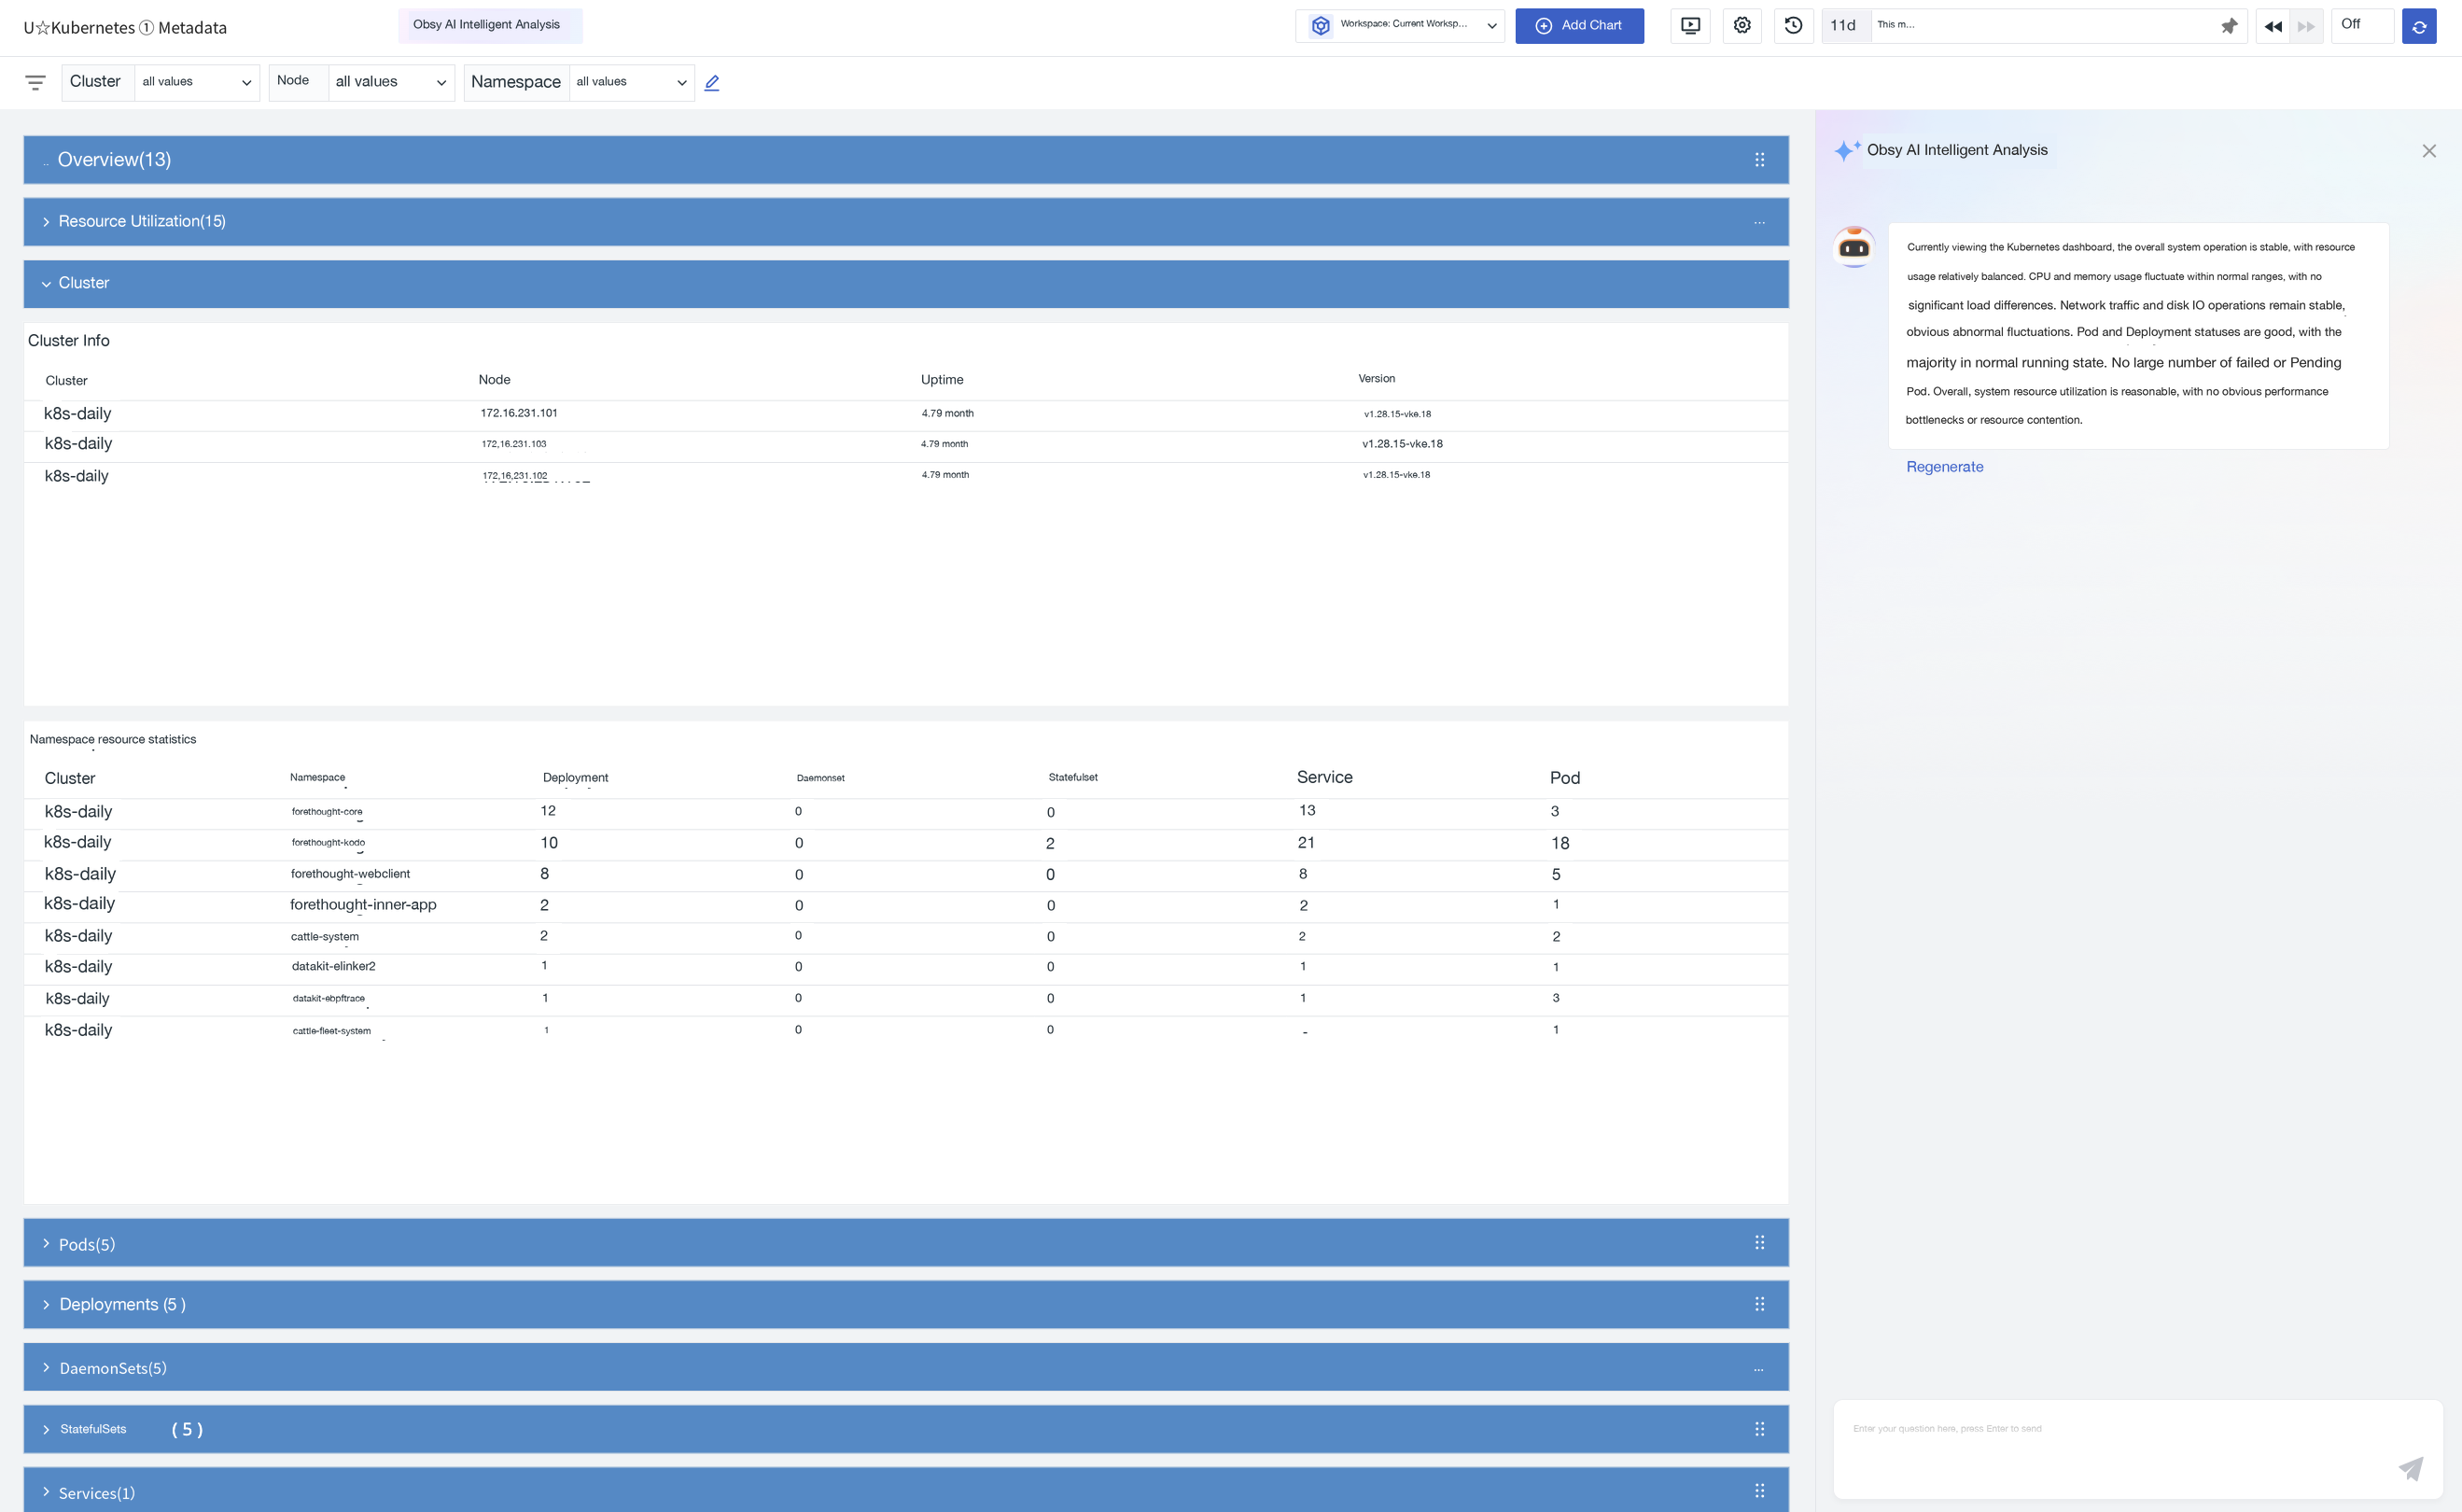
Quickly interpret multi-dimensional metric views in the dashboard and detect faults through natural language questions.
Note
-
This feature cannot be used when the total number of charts in the dashboard exceeds 100 or the time widget selection range is greater than 3 days.
-
Chart types currently supported for TOBY AI Intelligent Analysis include: Time Series charts, Bar charts, Column charts, Top Lists, Pie charts, Summary charts, Table charts, Map charts, Group charts.
Chart Management
Adding Charts
After creating a dashboard, you can add charts. After selection, click "Finish Adding" at the top of the page.
Grouping
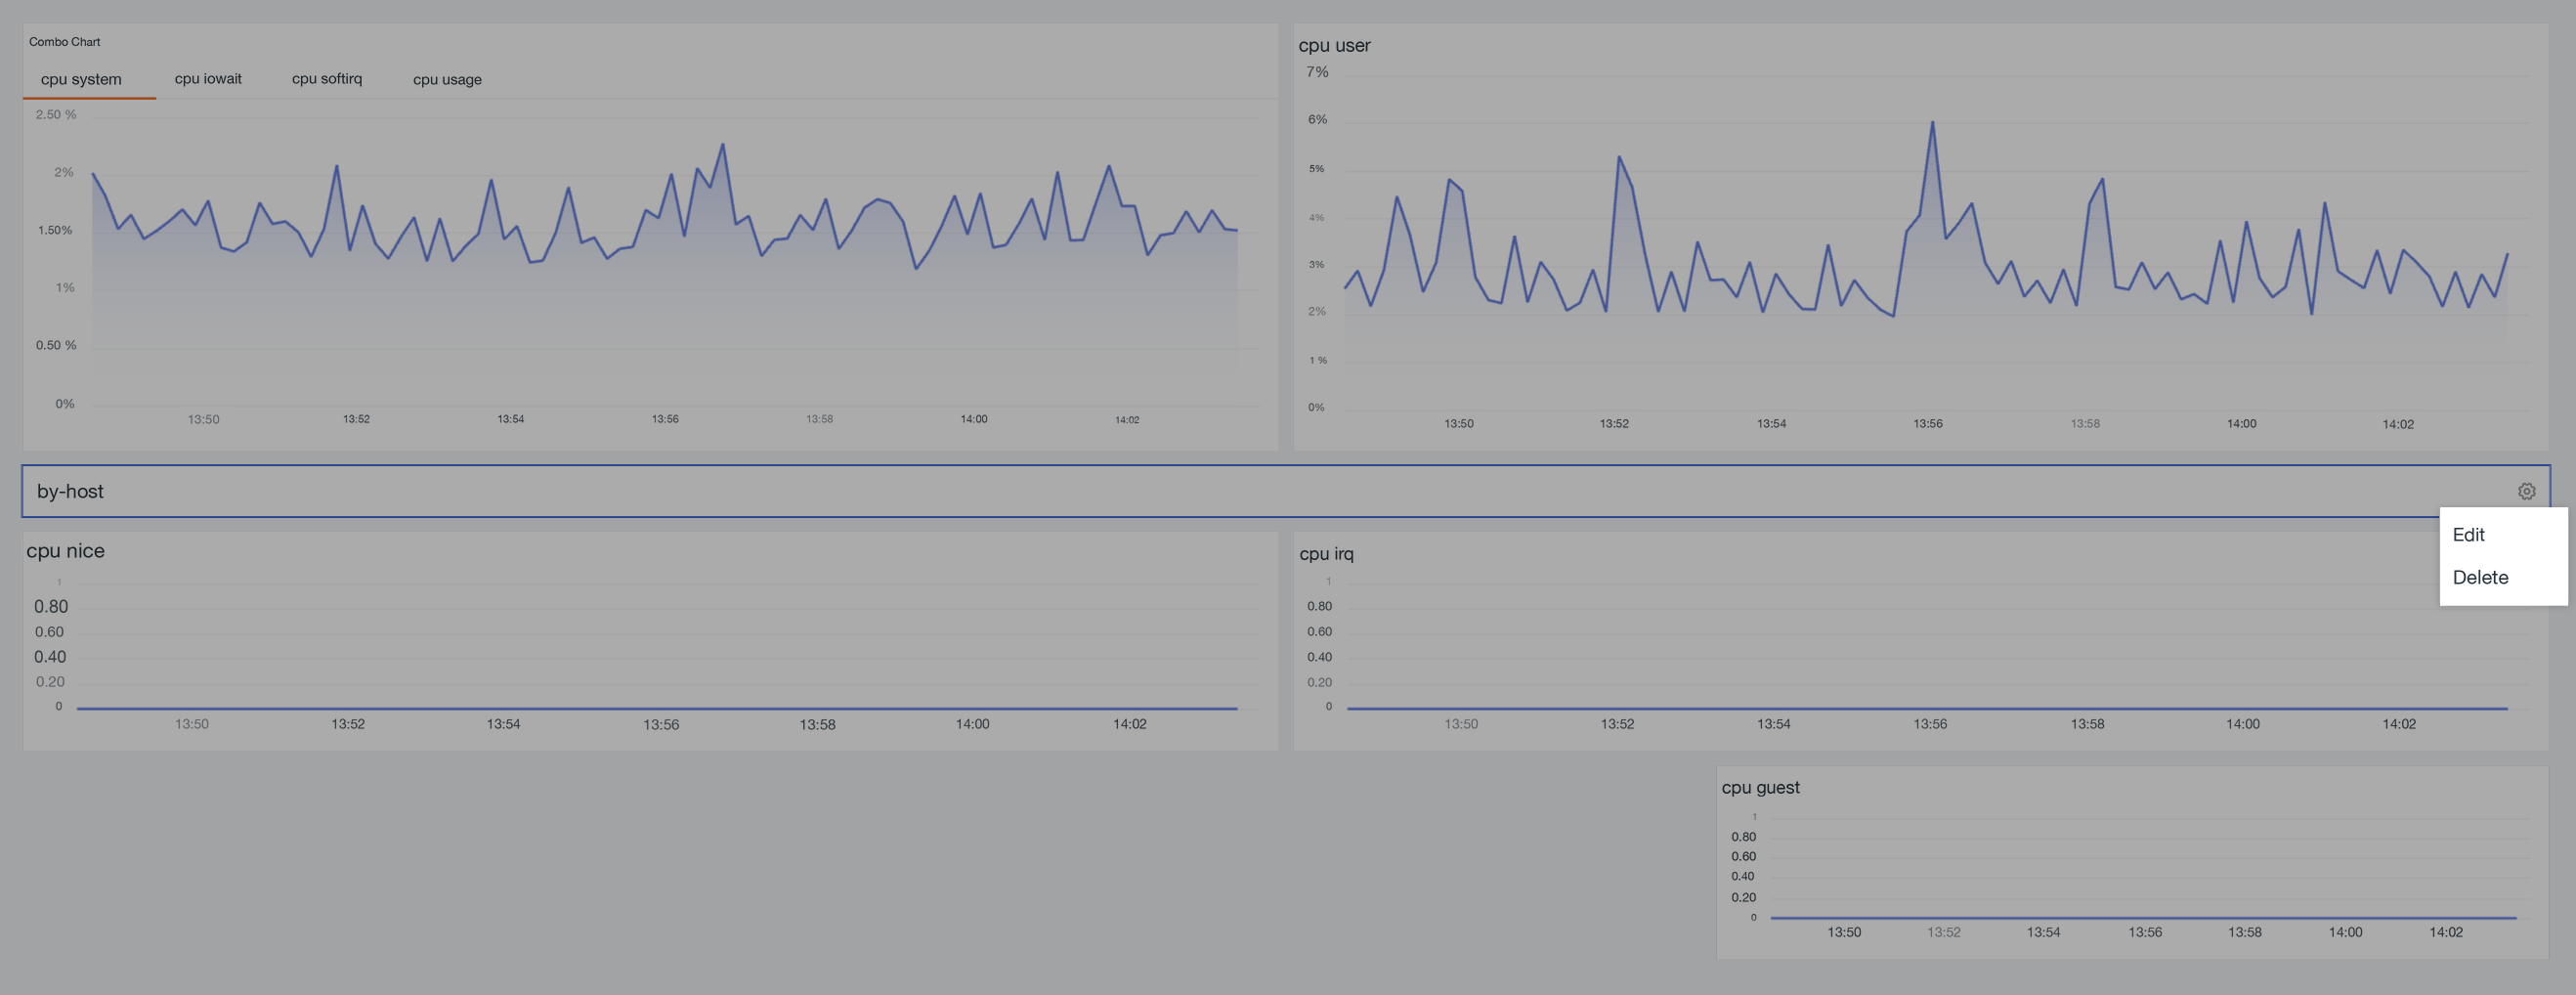
Categorize and manage charts:
- Click to enter Add Chart > Group.
- Enter the group name.
- Select the group's default state: expanded/collapsed.
- Choose the group color as needed.
- Confirm.
To modify this group, hover and click the settings button on the right.
Data and Display Control
Auto Refresh
Helps quickly obtain real-time dashboard data. Optional frequencies: 5s, 10s, 30s, 1m, 5m, 30m, 1h.
If auto-refresh is not needed, select Off (close).
Note
All dashboards and views share a single refresh configuration.
Filter
Click the filter, and the system will display a search bar. Customize input attributes and values for global filtering. All charts will apply this filter condition synchronously.
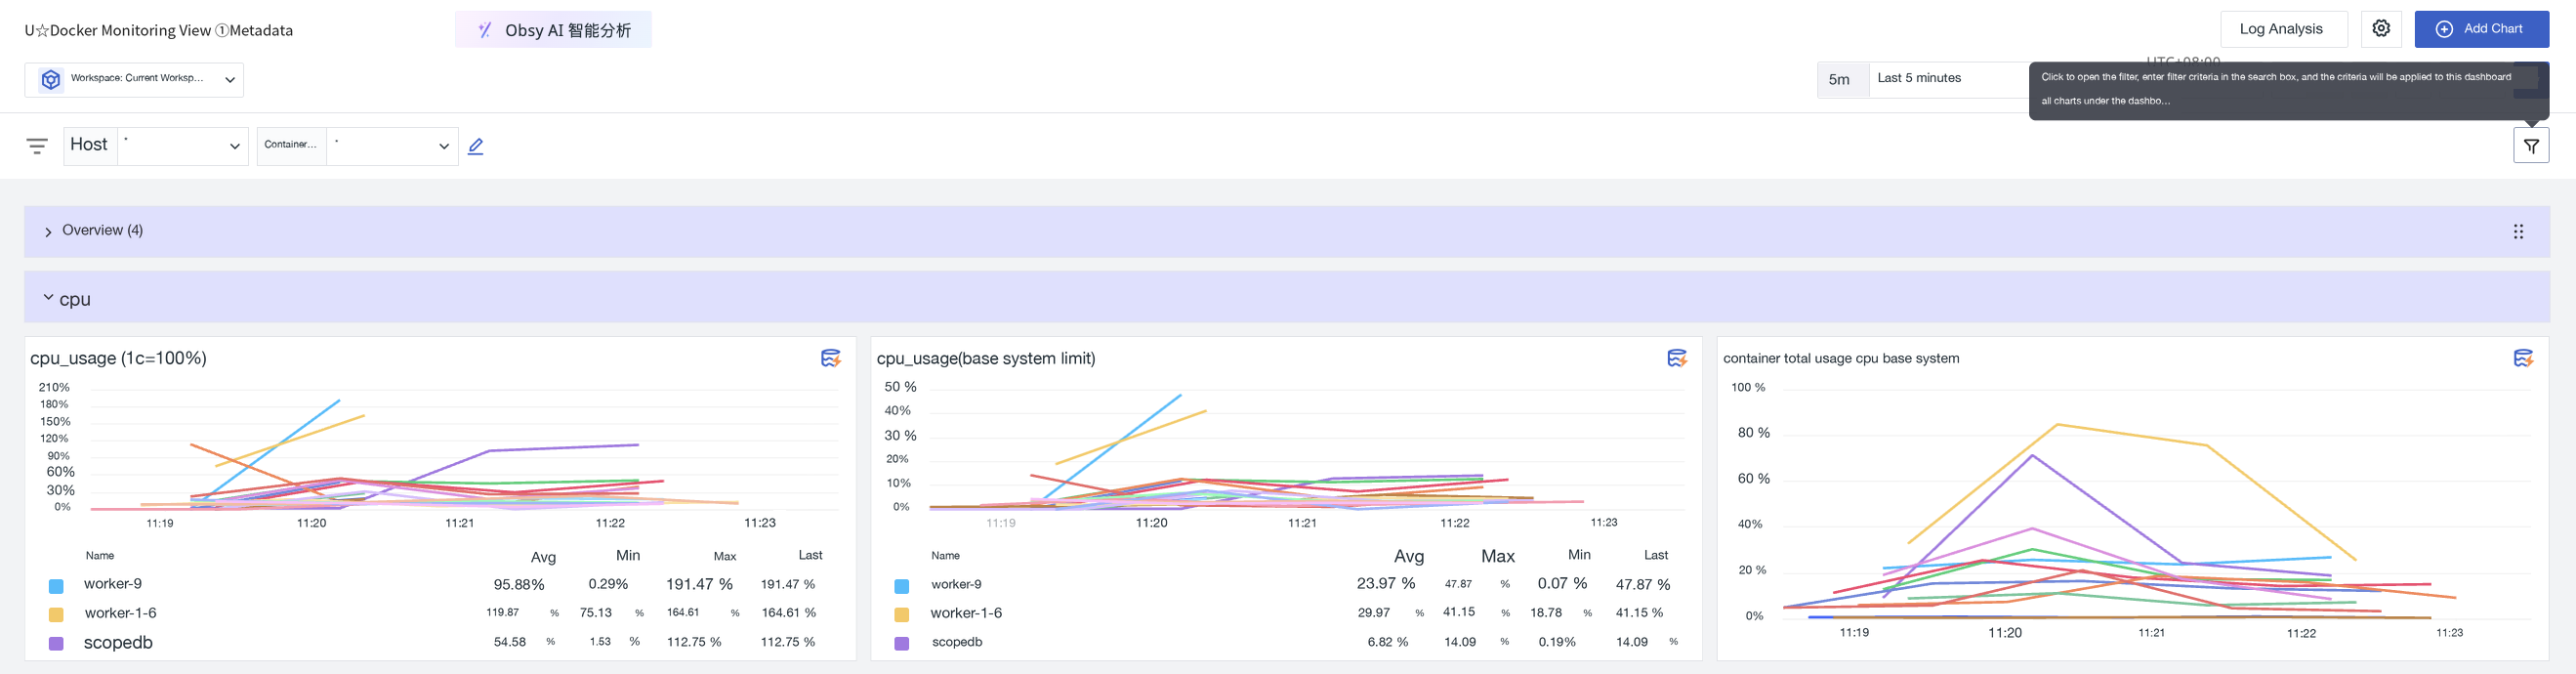
Use Cases
Click a data point on a chart to add tag_name:tag_value to the filter and execute the query. Supports clicking multiple tags consecutively to view query trend changes.
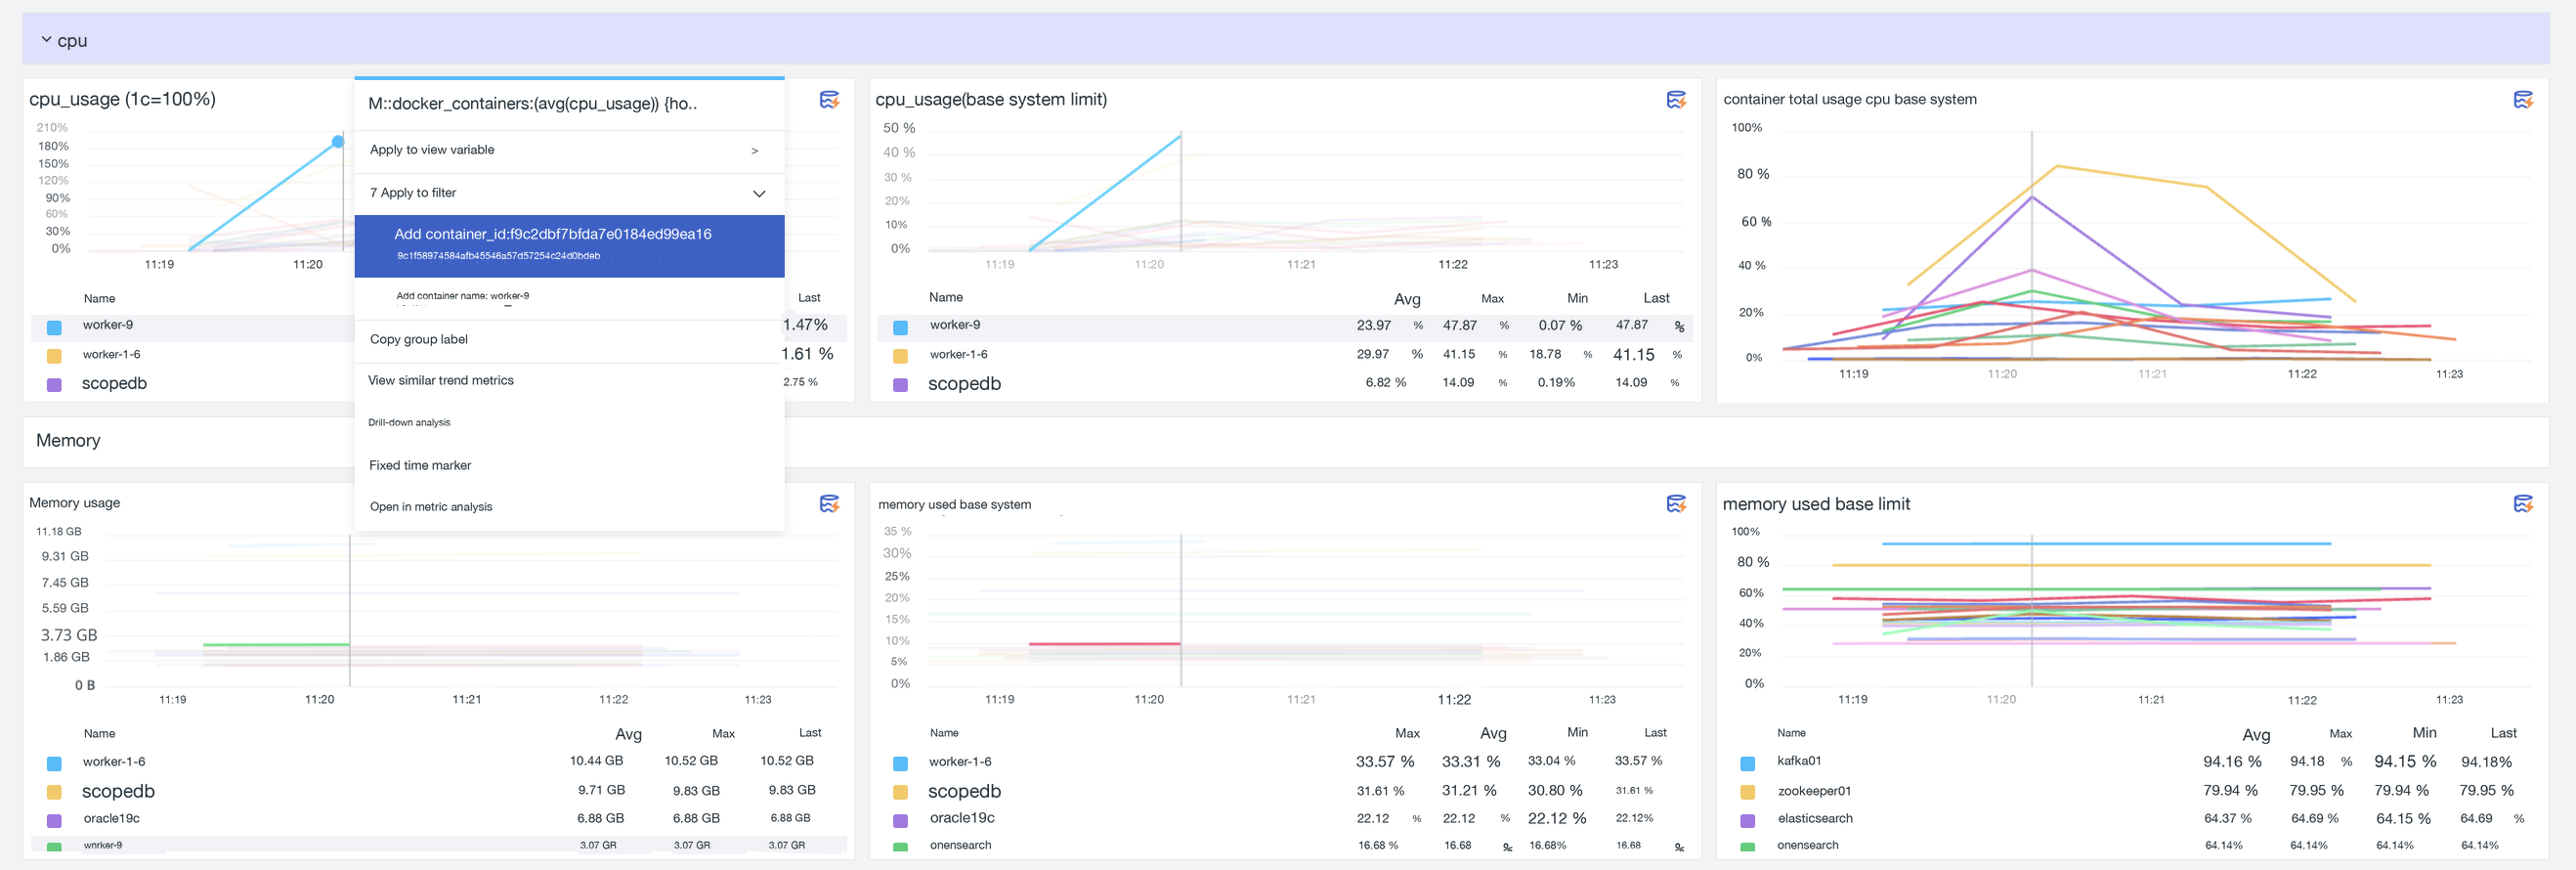
Cross-Workspace Query
If the current workspace is granted access to data from other workspaces, you can switch workspaces within the dashboard to view corresponding chart information.
Note
If a chart already has workspace query configuration, its priority is higher than the global configuration.

Pin
When accessing a workspace authorized to view data from other workspaces, you can choose to pin the authorized workspace, setting it as the default query target.

Note
-
Since only one workspace can be specified as the default option at a time, setting another workspace as the default will invalidate the previously set default option.
-
After unpinning, the system defaults to querying the current workspace.
-
Read-only members do not support this operation.
Settings Panel
After creating the dashboard, click to perform a series of operations on the dashboard.
History Versions
View the historical operation records of this dashboard from the past three months.
Clone Dashboard
- Enter the name for the copied dashboard.
- Select the visibility scope for the dashboard.
- Confirm. The cloned dashboard can be viewed later in the dashboard list.
Save Snapshot
- Enter the snapshot name.
- Select the visibility scope.
- Select the time range. This selected time range will be automatically filled when opening this snapshot again later.
- Confirm.
In addition to opening the save page via the button, you can also use the shortcut (Windows: Ctrl+K / Mac OS: Cmd+K) to quickly save a snapshot. After saving, you can view it at Shortcut > Snapshots.
For more details, refer to Snapshots.
Report Records
Click to enter the "Report Records" page. The system will list all reports for the current dashboard on the right side and display the data of the latest report record by default, allowing you to view archived static data and perform analysis.
You can perform the following operations:
- Filter based on report names in the dropdown.
- Click on the right side of a single report to share or delete the current report.
Share Report
- The system defaults to the time range of this report, which cannot be changed here.
- Select the validity period for the shared report: 1 day, 3 days, 7 days, permanent.
- Choose the sharing method:
- Public Share: Users who obtain the share link can view the workspace data displayed in the snapshot.
- Encrypted Share: Set a share code in the format of
4-8 digit alphanumeric combination. Only users with both the share link and share code can view it.
- Choose whether to display the top bar. If enabled, the shared page will display platform introduction instructions at the top.
- Choose whether to display a watermark. If enabled, a watermark with the sharer's name will be displayed in the format "Shared by: Name".
- After completing the configuration, you can click "Preview Report" to see the effect.
- Finally, create the share.
View Shared Reports
All reports for which sharing operations have been performed can be viewed by going to Manage > Share Management > Shared Reports. Information includes report name, sharing method, validity period, time range, sharer, etc.
On the current page, you can perform the following operations:
- View shared reports.
- View share links.
- Cancel sharing.
Create Report
For configuration steps, refer to Create Report.
Fullscreen Mode
Click the "Fullscreen" button, and the system will collapse the left and top navigation bars to display the view in full screen. Press the ESC button to exit.
Save to Built-in View
Save the current dashboard as a reusable view template:
- Modify the view name (defaults to the dashboard name).
- Set the binding relationship (e.g.,
label:*). - Confirm.
Note
User views within the same workspace are not allowed to have duplicate names.
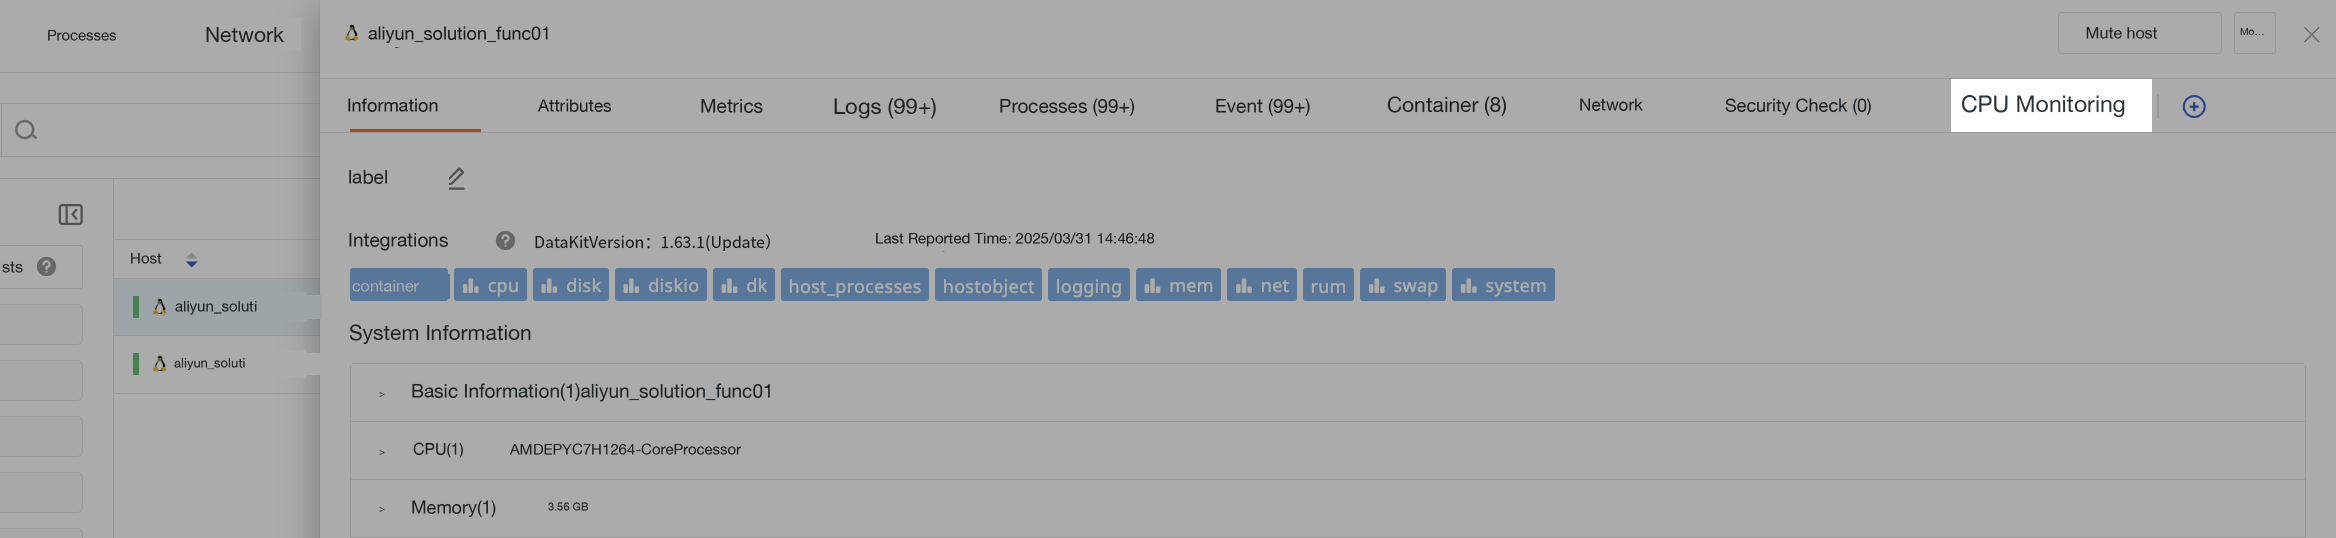
After saving, you can view the saved dashboard view "CPU Monitoring View" at Scenarios > Built-in Views > User Views.
Because the binding relationship label:* is set, the bound built-in view "CPU Monitoring View" can be viewed on the details pages of hosts and containers where the "Label Attribute" has been set in the infrastructure.
Export/Import Dashboard JSON
You can export the current dashboard's JSON file or import a JSON file to overwrite the current dashboard. Once overwritten, it cannot be recovered.
Share Dashboard
Supports two sharing dimensions:
| Sharing Method | Target Audience | Typical Use Cases |
|---|---|---|
| External Share | People outside the organization, public channels | Reporting to external personnel, public reports or data display, temporary external collaboration |
| Internal Share | Workspace members | Team meetings, internal presentations, short-term rapid collaboration |
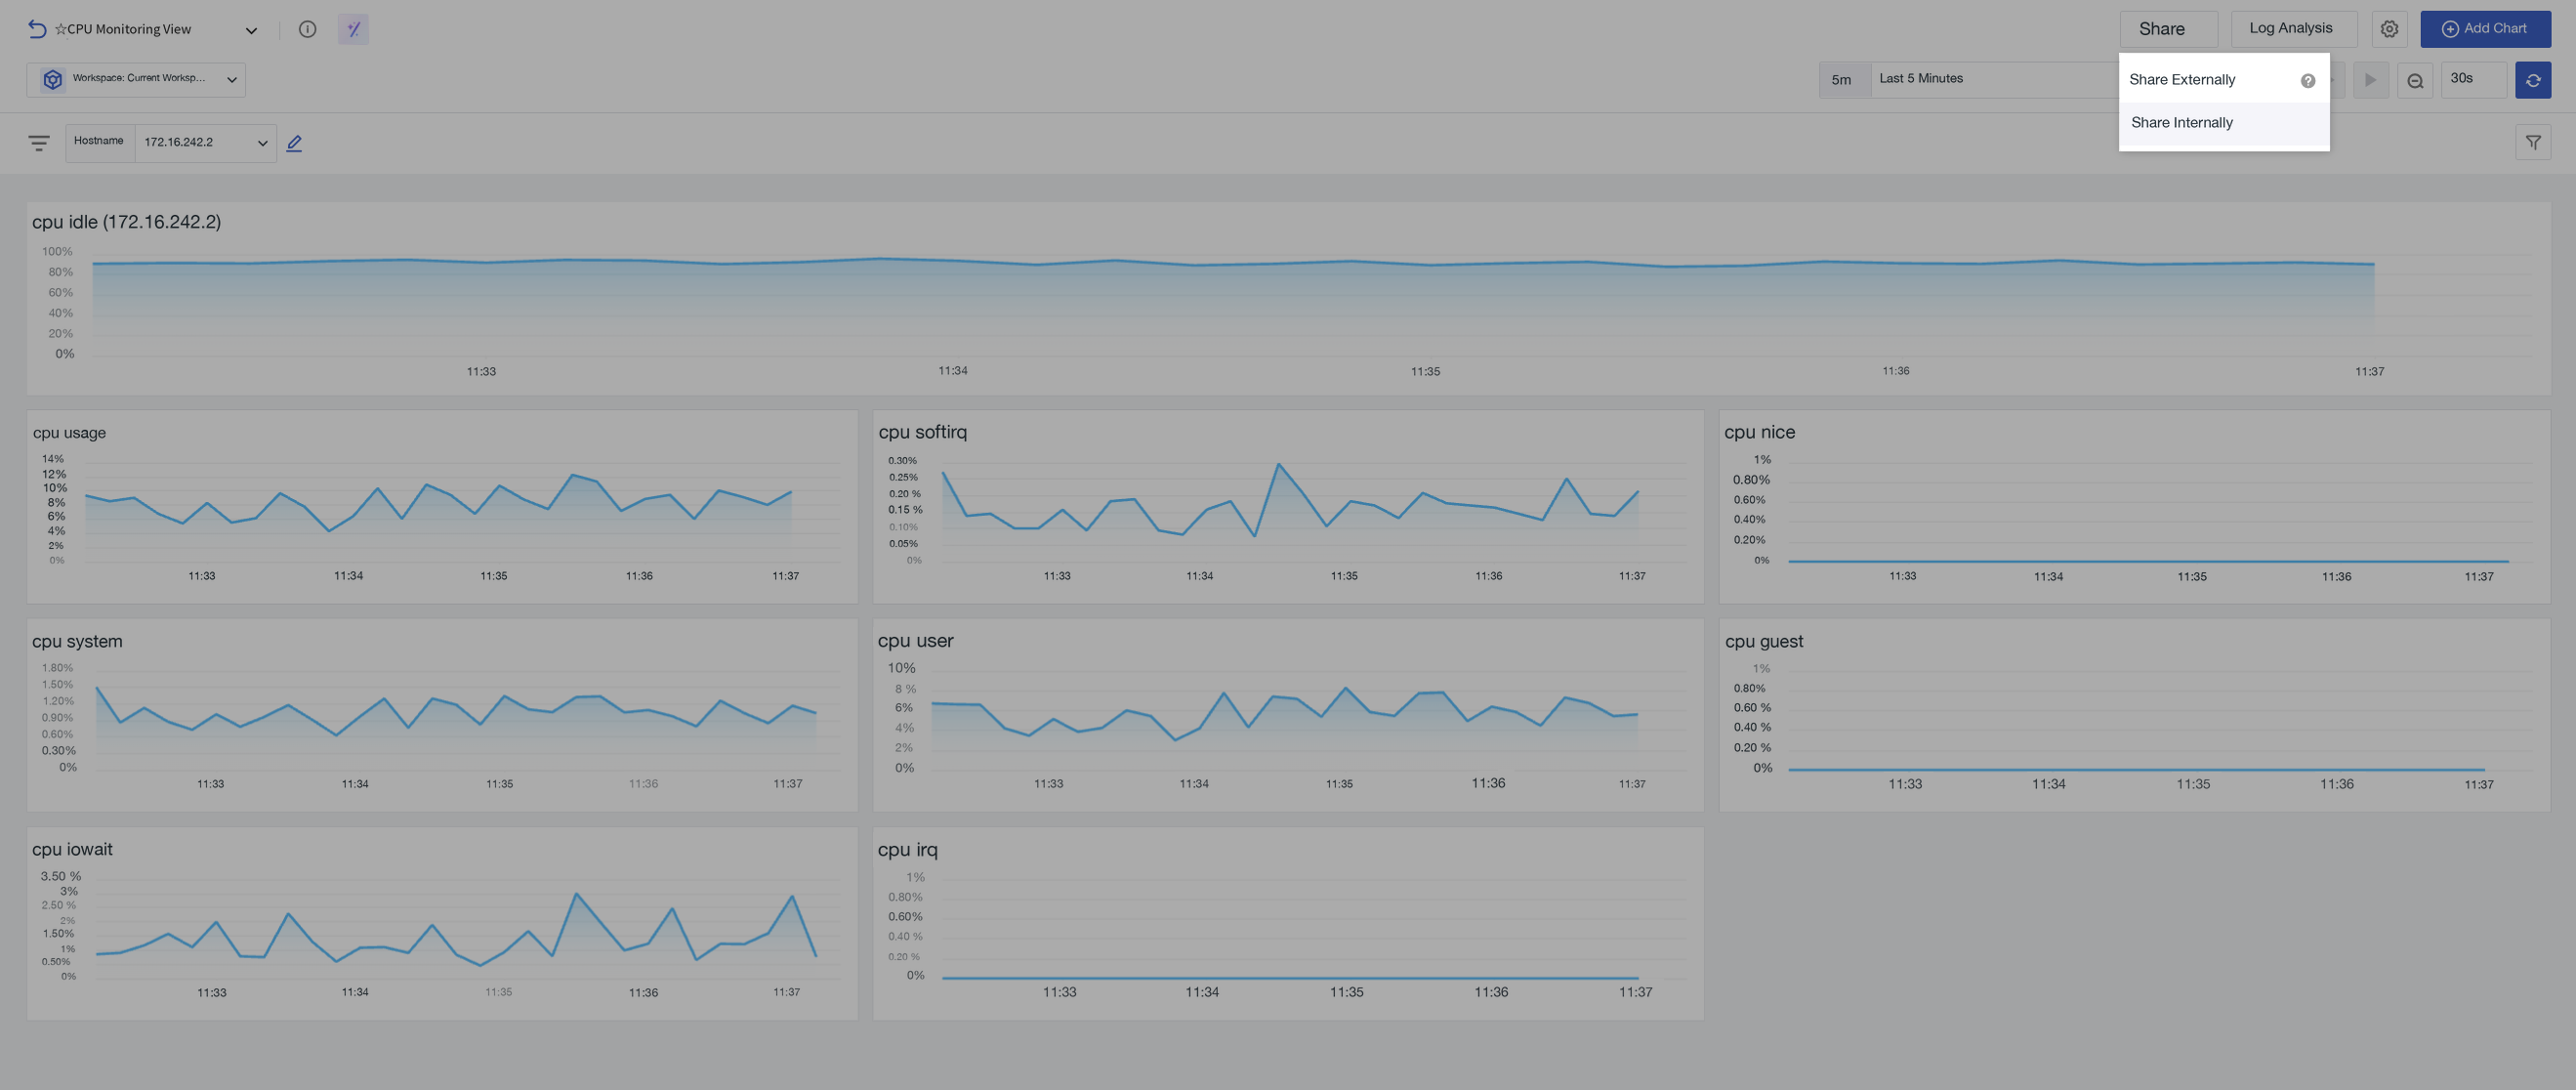
Shared dashboards are stored in Manage > Share Management > Shared Dashboards. You can go there to view them. Or directly click "View Shared Dashboard List" at the top of the sharing interface.
External Share
Configure Share
Before sharing the current dashboard externally, please confirm the dashboard is set to "Publicly Visible". Then, three types of configuration must be completed:
1. Basic Configuration
- Time Range: The system defaults to the time of the current dashboard charts. This will be the time interval of the dashboard that shared recipients can view after sharing.
- Define the shared dashboard name.
- Select validity period, including: 1 day, 3 days, 7 days, permanent.
- Option to set the dashboard to be automatically deleted upon expiration after sharing.
- Choose sharing method:
- Public Share
- Encrypted Share: Define a share code. Recipients need to enter the share code to view the charts.
- More Options:
- Choose whether to display the top bar, watermark.
- Choose whether to lock view variables. External sharing supports locking view variables; recipients cannot change filter conditions when viewing. After sharing, the view variable dropdown seen by recipients will show fixed values and cannot be switched.
2. Data Masking
You can configure masking for field value content within the dashboard. Input the masking field and regular expression, click preview. Content matched by the regex will be displayed as * in the current dashboard.
- Input masking field(s) (supports multiple selection).
- Regular Expression: Implement masking through regex syntax.
For more operations, refer to Field Display Permissions.
3. Access Restrictions
Choose whether to enable an access IP whitelist for the currently shared dashboard.
- Workspace IP Whitelist: Follows the workspace's IP whitelist configuration changes. Editing and modification are not supported under dashboard sharing.
- Custom Input: Can custom input IP access whitelist. IPs not listed cannot view the dashboard.
For more details, refer to How to Configure IP Whitelist.
Internal Share
Configure Share
- Time Range: The system defaults to the time of the current dashboard charts. This will be the time interval of the dashboard that shared recipients can view after sharing.
- Option to save as static time.
- Directly copy the current link; optionally shorten the link length.
Log Analysis
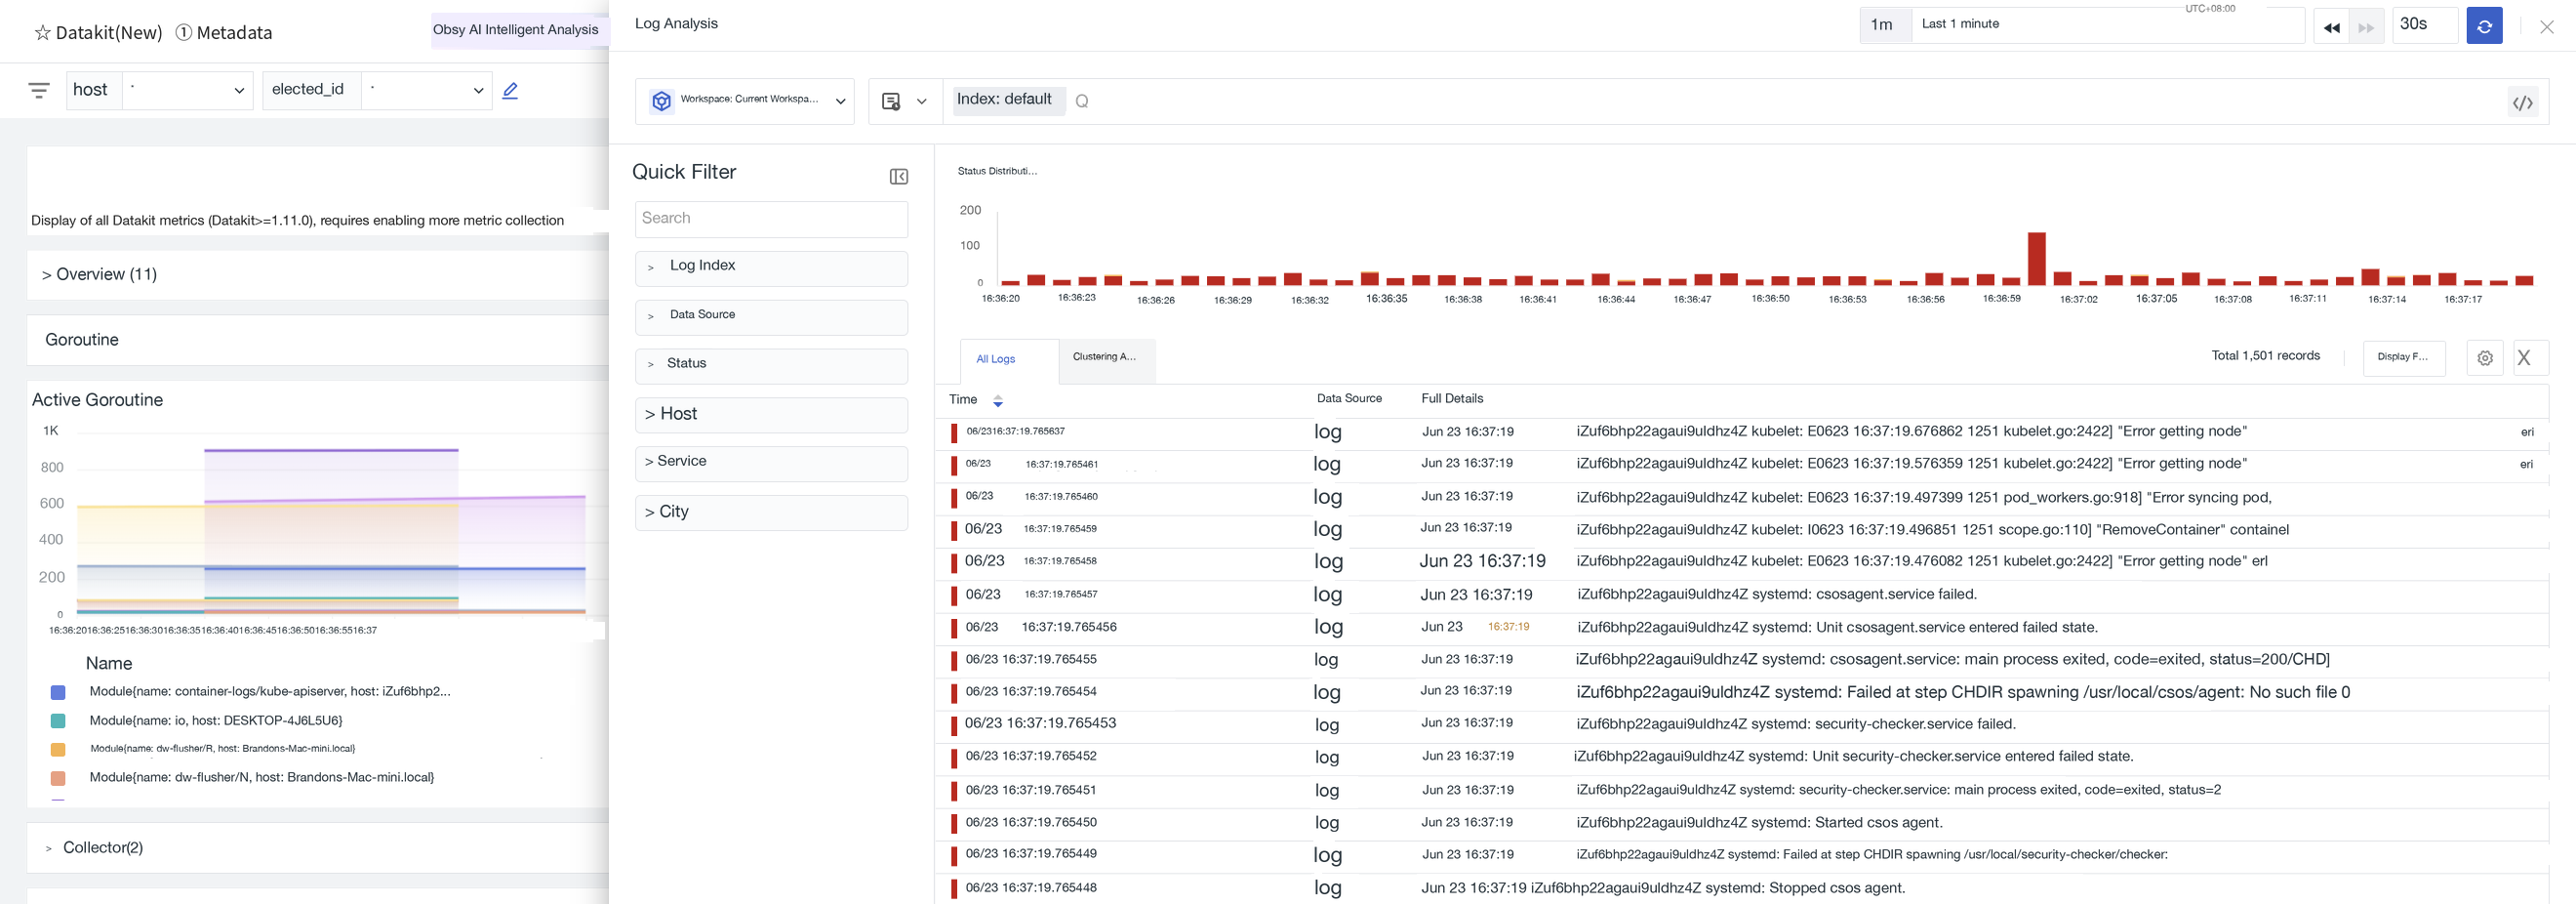
When performing view analysis within a dashboard, click "Log Analysis" to instantly view and analyze related log data in a new side-sliding page. To view in full screen, click "Log Analysis" again at the top of the side-sliding page to jump to a full-screen log explorer in a new window.
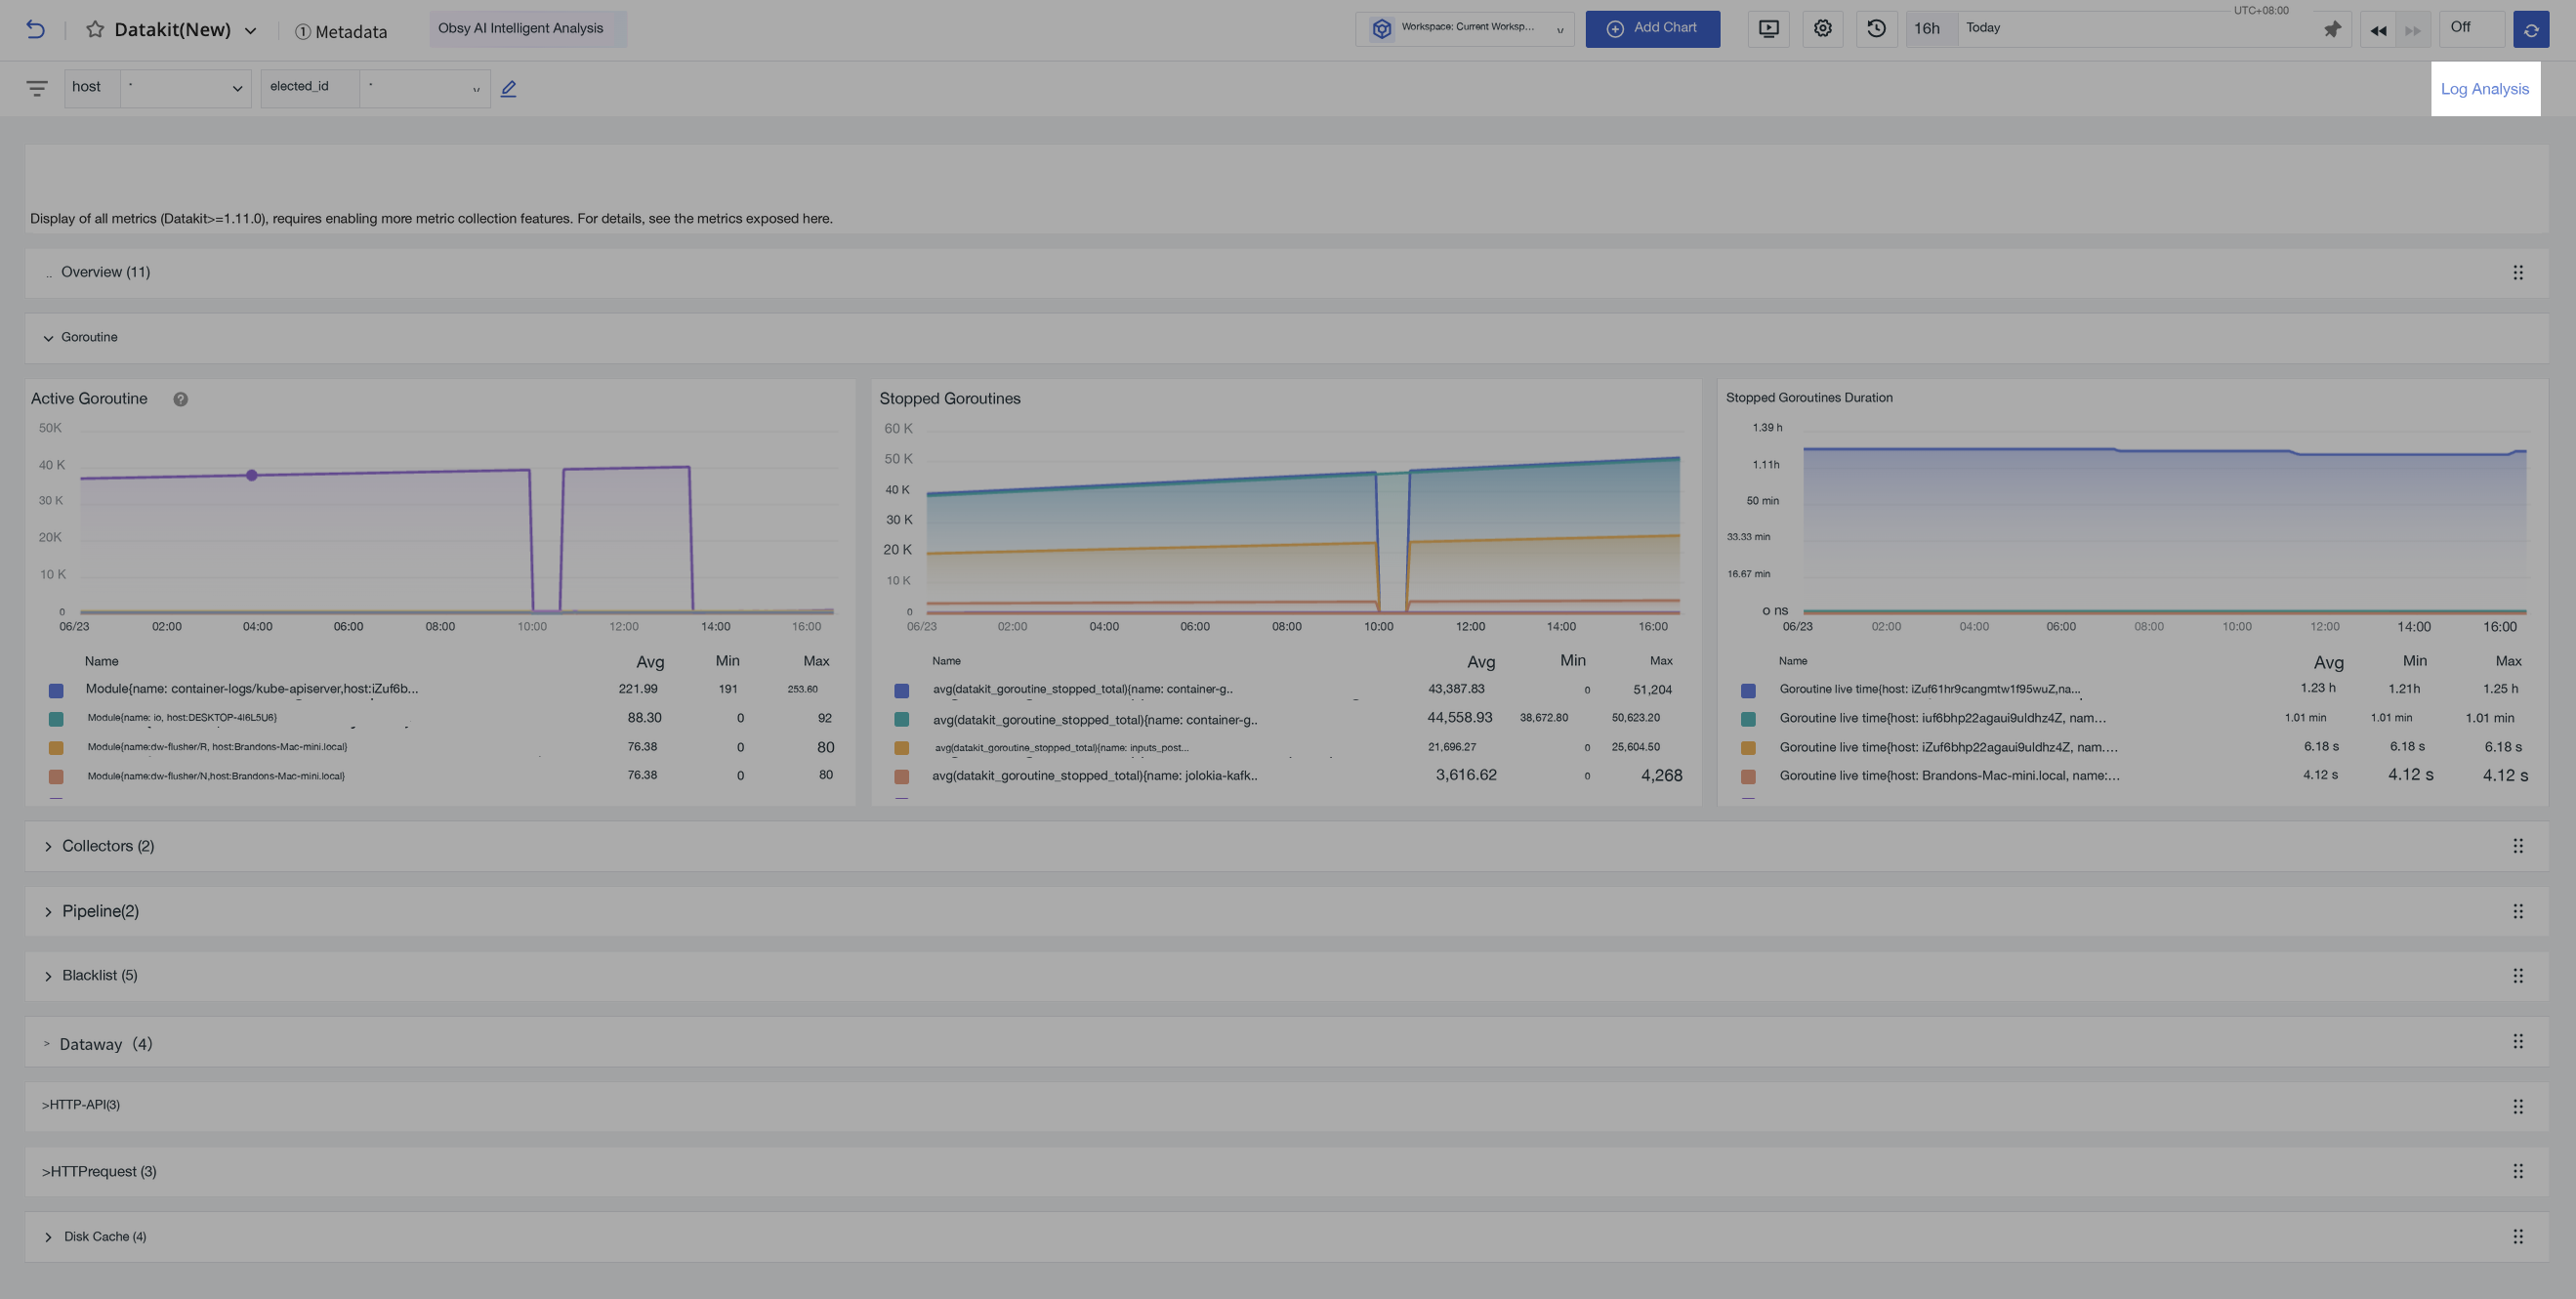
In the side-sliding page, the log explorer automatically uses the dashboard's view variables as filter conditions, queries based on the time range set for the dashboard, and displays log list data in standard mode.
Note
If the selected value for a view variable in this dashboard is *, the filter condition is not displayed by default in the log explorer.